## Heatmaps: Comparison of Sampling Methods
### Overview
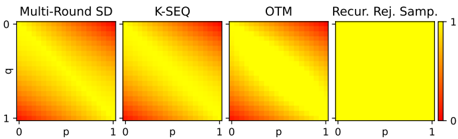
The image presents four heatmaps, each representing a different sampling method: Multi-Round SD, K-SEQ, OTM, and Recur. Rej. Samp. The heatmaps visualize a relationship between two variables, 'p' and 'q', both ranging from 0 to 1. The color intensity within each heatmap indicates the value at each (p, q) coordinate, with red representing lower values and yellow representing higher values.
### Components/Axes
* **Titles (Top):**
* Multi-Round SD
* K-SEQ
* OTM
* Recur. Rej. Samp.
* **X-axis:** Labeled 'p', ranging from 0 to 1.
* **Y-axis:** Labeled 'q', ranging from 0 to 1.
* **Color Scale (Right):** Ranges from 0 (red) to 1 (yellow).
### Detailed Analysis
Each heatmap is a square grid, with 'p' on the horizontal axis and 'q' on the vertical axis.
* **Multi-Round SD:** The heatmap shows a gradient. The bottom-left corner (p=0, q=1) is red, indicating a low value. The top-right corner (p=1, q=0) is yellow, indicating a high value. The color transitions smoothly between these extremes.
* **K-SEQ:** Similar to Multi-Round SD, this heatmap also shows a gradient from red (bottom-left) to yellow (top-right). The transition appears slightly less smooth than in Multi-Round SD.
* **OTM:** This heatmap also shows a gradient from red (bottom-left) to yellow (top-right). The transition appears similar to K-SEQ.
* **Recur. Rej. Samp.:** This heatmap is predominantly yellow, indicating high values across most of the (p, q) space. There is a very faint red hue in the bottom-left corner, but the overall color is significantly different from the other three heatmaps.
### Key Observations
* The Multi-Round SD, K-SEQ, and OTM methods exhibit similar patterns, with values increasing as 'p' increases and 'q' decreases.
* The Recur. Rej. Samp. method shows a distinctly different pattern, with consistently high values across the majority of the space.
### Interpretation
The heatmaps visually compare the output of four different sampling methods across a range of 'p' and 'q' values. The similar gradients in Multi-Round SD, K-SEQ, and OTM suggest that these methods produce comparable results under the given conditions. The Recur. Rej. Samp. method, however, appears to behave differently, yielding high values regardless of the 'p' and 'q' inputs. This could indicate a bias or a different sampling strategy compared to the other methods. The data suggests that Recur. Rej. Samp. might be less sensitive to the 'p' and 'q' parameters within the tested range.