\n
## Heatmaps: Performance Comparison of Sampling Methods
### Overview
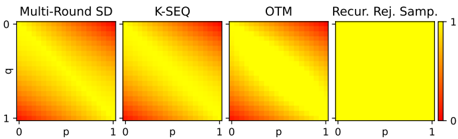
The image presents four heatmaps, each representing the performance of a different sampling method: Multi-Round SD, K-SEQ, OTM, and Recur. Rej. Samp. The heatmaps visualize the relationship between two parameters, 'p' and 'q', with performance indicated by color intensity. The color scale ranges from 0 (blue/dark) to 1 (red/light), suggesting higher values represent better performance.
### Components/Axes
Each heatmap shares the same axes:
* **X-axis:** Labeled 'p', ranging from 0 to 1.
* **Y-axis:** Labeled 'q', ranging from 0 to 1.
* **Color Scale:** A gradient from blue (approximately 0) to red (approximately 1), positioned to the right of the four heatmaps.
The four heatmaps are arranged horizontally, each with a title indicating the sampling method:
1. Multi-Round SD
2. K-SEQ
3. OTM
4. Recur. Rej. Samp.
### Detailed Analysis or Content Details
**1. Multi-Round SD:**
* The heatmap shows a generally upward trend. Values are low (close to 0, yellow) in the bottom-left corner (low p, low q) and increase towards high values (close to 1, red) in the top-right corner (high p, high q).
* The gradient is relatively smooth.
**2. K-SEQ:**
* Similar to Multi-Round SD, this heatmap also exhibits an upward trend. Values are low in the bottom-left and increase towards the top-right.
* The gradient appears slightly steeper than Multi-Round SD.
**3. OTM:**
* This heatmap also shows an upward trend, but the gradient is less pronounced than the previous two.
* The color transition is more gradual, with a larger area of intermediate values.
**4. Recur. Rej. Samp.:**
* This heatmap displays a downward trend. Values are high (close to 1, red) in the bottom-left corner (low p, low q) and decrease towards low values (close to 0, yellow) in the top-right corner (high p, high q).
* The gradient is relatively smooth.
### Key Observations
* Three of the methods (Multi-Round SD, K-SEQ, and OTM) show a positive correlation between 'p' and 'q' and performance. Increasing both parameters leads to better results.
* Recur. Rej. Samp. exhibits an inverse correlation – increasing both 'p' and 'q' leads to *worse* results.
* K-SEQ appears to have the steepest gradient, suggesting it is most sensitive to changes in 'p' and 'q'.
* OTM appears to be the least sensitive to changes in 'p' and 'q'.
### Interpretation
The heatmaps compare the performance of four different sampling methods across a range of parameter values 'p' and 'q'. The differing trends suggest that each method responds differently to these parameters. The positive correlation observed in Multi-Round SD, K-SEQ, and OTM indicates that increasing both 'p' and 'q' generally improves performance for these methods. Conversely, the negative correlation in Recur. Rej. Samp. suggests that this method performs best when 'p' and 'q' are low.
The differences in gradient steepness suggest varying sensitivities to parameter changes. K-SEQ's steeper gradient implies that small adjustments to 'p' and 'q' can significantly impact its performance, while OTM is more robust to such changes.
This data could be used to select the most appropriate sampling method for a given application, based on the desired values of 'p' and 'q' and the level of sensitivity required. The specific meaning of 'p' and 'q' is not provided in the image, but they likely represent parameters controlling the sampling process itself.