## Heatmap: Parameter Space Analysis Across Methods
### Overview
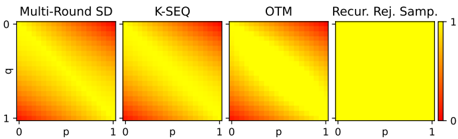
The image displays a composite heatmap divided into four equal sections, each representing a different method or category: "Multi-Round SD," "K-SEQ," "OTM," and "Recur. Rej. Samp." Each section visualizes a 2D parameter space with axes labeled **p** (horizontal, 0–1) and **b** (vertical, 0–1). A shared color gradient (red to yellow) indicates values from 0 to 1, with a legend on the right side of the image.
---
### Components/Axes
- **Axes**:
- **Horizontal (x-axis)**: Labeled **p**, ranging from 0 to 1.
- **Vertical (y-axis)**: Labeled **b**, ranging from 0 to 1.
- **Legend**: A vertical color bar on the far right, mapping:
- **Red**: Value = 0
- **Yellow**: Value = 1
- **Sections**:
- **Top-left**: "Multi-Round SD"
- **Top-right**: "K-SEQ"
- **Bottom-left**: "OTM"
- **Bottom-right**: "Recur. Rej. Samp."
---
### Detailed Analysis
1. **Multi-Round SD**:
- Diagonal gradient from red (bottom-left) to yellow (top-right).
- Suggests a linear relationship between **p** and **b** with increasing values.
2. **K-SEQ**:
- Identical gradient pattern to "Multi-Round SD."
- Consistent diagonal increase from red to yellow.
3. **OTM**:
- Matches the diagonal trend of the first two sections.
- No deviations observed; uniform gradient.
4. **Recur. Rej. Samp.**:
- Entirely yellow (value = 1).
- No variation across **p** or **b** values.
---
### Key Observations
- **Uniformity**: The first three methods ("Multi-Round SD," "K-SEQ," "OTM") exhibit identical gradient patterns, suggesting similar behavior in their parameter spaces.
- **Anomaly**: "Recur. Rej. Samp." deviates sharply, with all values maxed at 1, indicating a constant or saturated outcome.
- **Color Consistency**: All sections align with the legend (red = 0, yellow = 1), confirming accurate interpretation.
---
### Interpretation
- **Parameter Relationships**: The diagonal gradients in the first three methods imply that higher **p** and **b** values correlate with increased outcomes (e.g., success rates, efficiency). This could reflect optimization trends or sensitivity to parameter tuning.
- **Recur. Rej. Samp. Exception**: The uniform yellow suggests this method operates at maximum capacity regardless of **p** or **b**, possibly indicating a fixed threshold or saturation point in its design.
- **Method Comparison**: The identical gradients for "Multi-Round SD," "K-SEQ," and "OTM" may highlight shared underlying mechanisms or similar performance characteristics across these approaches.
This visualization emphasizes how parameter tuning impacts outcomes across methods, with "Recur. Rej. Samp." standing out as an outlier due to its invariant behavior.