## Bar Chart: Test Accuracy vs. Width Variation
### Overview
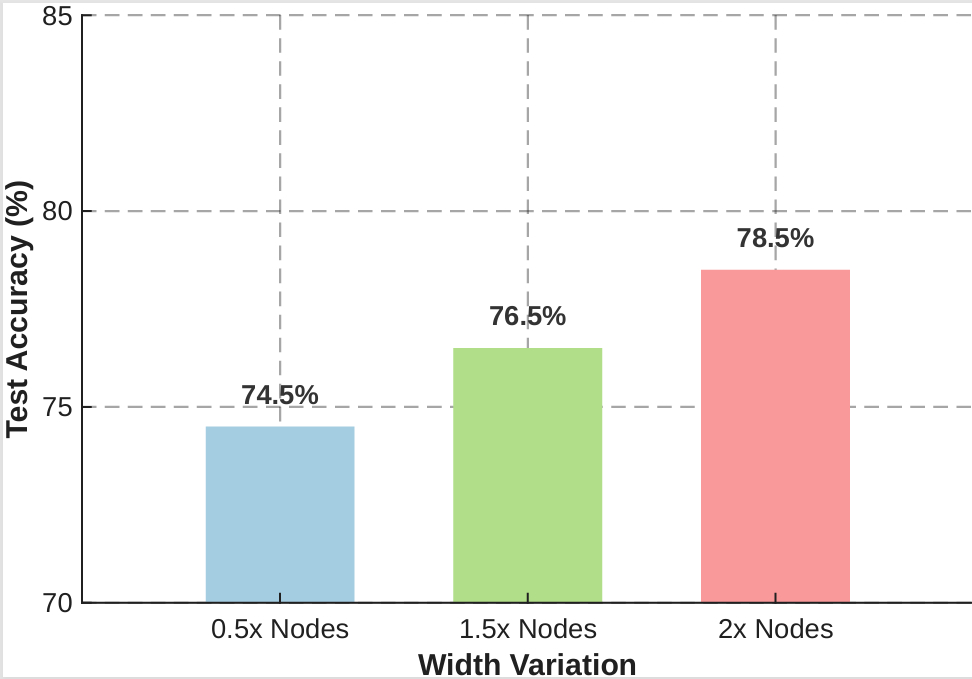
The image is a bar chart illustrating the relationship between model "Width Variation" (measured in node multipliers) and "Test Accuracy (%)". The chart displays three distinct data points, showing a consistent positive correlation between increasing the number of nodes and the resulting test accuracy.
### Components/Axes
* **Y-Axis (Vertical):** Labeled "Test Accuracy (%)". The scale ranges from 70 to 85, with major horizontal grid lines marked at 70, 75, 80, and 85.
* **X-Axis (Horizontal):** Labeled "Width Variation". It contains three categorical labels positioned at the base of each bar: "0.5x Nodes", "1.5x Nodes", and "2x Nodes".
* **Data Series:** Three vertical bars of varying colors and heights.
* **Left Bar:** Light blue.
* **Center Bar:** Light green.
* **Right Bar:** Light red/pink.
### Detailed Analysis
The chart displays a monotonic upward trend from left to right.
* **0.5x Nodes (Left):**
* **Position:** Leftmost position on the X-axis.
* **Color:** Light blue.
* **Value:** The bar height is explicitly labeled as **74.5%**. Visually, it sits just below the 75% grid line.
* **1.5x Nodes (Center):**
* **Position:** Center position on the X-axis.
* **Color:** Light green.
* **Value:** The bar height is explicitly labeled as **76.5%**. Visually, it sits above the 75% grid line.
* **2x Nodes (Right):**
* **Position:** Rightmost position on the X-axis.
* **Color:** Light red/pink.
* **Value:** The bar height is explicitly labeled as **78.5%**. Visually, it sits higher than the center bar, approaching the 80% grid line.
### Key Observations
* **Linear Scaling:** The increase in accuracy is perfectly consistent across the three data points.
* **Delta Analysis:**
* The jump from "0.5x Nodes" to "1.5x Nodes" results in a **+2.0%** increase in accuracy.
* The jump from "1.5x Nodes" to "2x Nodes" results in a **+2.0%** increase in accuracy.
* **Consistency:** The chart demonstrates a stable, predictable improvement in performance as the model width is increased.
### Interpretation
The data demonstrates a clear positive correlation between model width (the number of nodes) and test accuracy. This is a typical representation of model scaling, where increasing the capacity of a neural network (in this case, its width) allows it to learn more complex patterns or generalize better, leading to higher accuracy on the test set.
The fact that the accuracy increases by exactly 2% at each step suggests that, within this specific range of width variation, the model is experiencing linear returns on its capacity expansion. There is no evidence of diminishing returns or overfitting within the provided data points, suggesting that further increases in width might continue to yield performance gains.