## Diagram: Search Strategy Workflow Sequences
### Overview
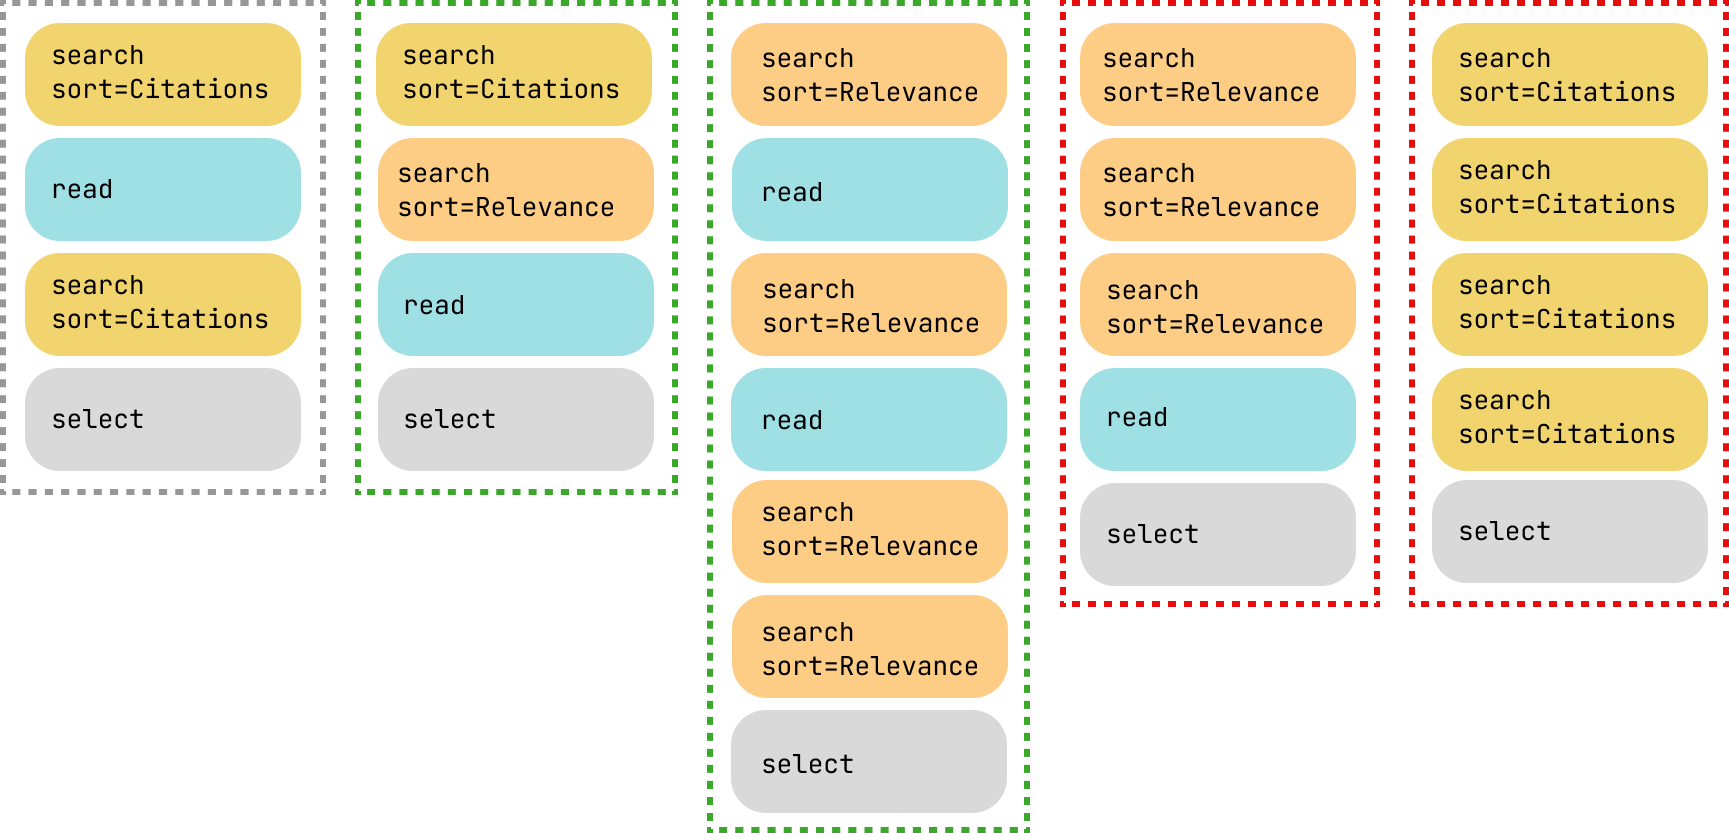
The image displays a technical diagram illustrating five distinct sequences or workflows for a search-and-select process. Each sequence is presented as a vertical column of action blocks, grouped by colored dashed borders. The diagram visually compares different strategies for conducting searches (sorted by "Citations" or "Relevance"), reading results, and making a final selection.
### Components/Axes
* **Structure:** Five vertical columns, each representing a discrete workflow sequence.
* **Column Borders (Grouping):**
* Column 1 (Far Left): Gray dashed border.
* Columns 2 & 3: Green dashed borders.
* Columns 4 & 5: Red dashed borders.
* **Action Blocks (Color-Coded):**
* **Yellow:** `search sort=Citations`
* **Orange:** `search sort=Relevance`
* **Light Blue:** `read`
* **Gray:** `select`
* **Layout:** Blocks are stacked vertically within each column, indicating a top-to-bottom sequence of actions.
### Detailed Analysis
**Column 1 (Gray Border):**
1. `search sort=Citations` (Yellow)
2. `read` (Light Blue)
3. `search sort=Citations` (Yellow)
4. `select` (Gray)
**Column 2 (Green Border):**
1. `search sort=Citations` (Yellow)
2. `search sort=Relevance` (Orange)
3. `read` (Light Blue)
4. `select` (Gray)
**Column 3 (Green Border):**
1. `search sort=Relevance` (Orange)
2. `read` (Light Blue)
3. `search sort=Relevance` (Orange)
4. `read` (Light Blue)
5. `search sort=Relevance` (Orange)
6. `search sort=Relevance` (Orange)
7. `select` (Gray)
**Column 4 (Red Border):**
1. `search sort=Relevance` (Orange)
2. `search sort=Relevance` (Orange)
3. `search sort=Relevance` (Orange)
4. `read` (Light Blue)
5. `select` (Gray)
**Column 5 (Red Border):**
1. `search sort=Citations` (Yellow)
2. `search sort=Citations` (Yellow)
3. `search sort=Citations` (Yellow)
4. `read` (Light Blue)
5. `select` (Gray)
### Key Observations
1. **Action Repetition:** The number of search actions before the final "read" and "select" varies significantly between sequences, from a minimum of two to a maximum of five.
2. **Strategy Specialization:** The red-bordered columns (4 & 5) show highly specialized strategies. Column 4 uses only `sort=Relevance` searches, while Column 5 uses only `sort=Citations` searches.
3. **Mixed Strategy:** The green-bordered columns (2 & 3) employ mixed search strategies. Column 2 mixes one Citations and one Relevance search. Column 3 is the most complex, featuring five Relevance searches interspersed with two read actions.
4. **Baseline/Control:** The gray-bordered Column 1 appears to be a simpler or baseline strategy, using two Citations searches with a single read action in between.
5. **Common Termination:** All five sequences conclude with a single `read` action followed immediately by a `select` action.
### Interpretation
This diagram models and compares different algorithmic or user-driven approaches to an information retrieval task. The core question it addresses is: **What is the optimal sequence and mix of search strategies (sorted by citation count vs. relevance) to efficiently find and select relevant information?**
* **Efficiency vs. Thoroughness:** The sequences represent a spectrum. Column 1 is lean and fast. Column 3 is exhaustive and iterative, suggesting a thorough, possibly academic, research process. Columns 4 and 5 represent committed, single-metric strategies.
* **The Role of "Read":** The `read` action is a critical evaluation step. Its placement varies—sometimes after every search (Column 3), sometimes only once at the end (Columns 4 & 5). This suggests a trade-off between continuous evaluation and batch processing.
* **Grouping Significance:** The border colors likely denote categories of strategies. Green may indicate "balanced" or "adaptive" approaches, red indicates "specialized" or "extreme" approaches, and gray may indicate a "standard" or "control" method.
* **Underlying Process:** The workflow implies a system where an agent (human or AI) performs searches, evaluates results through reading, and iterates based on findings before making a final selection. The diagram is a tool for analyzing the cost (in steps) and potential effectiveness of each procedural recipe.