## Line Charts: Cross Entropy (CE) vs. Tokens Seen for Different Training Strategies
### Overview
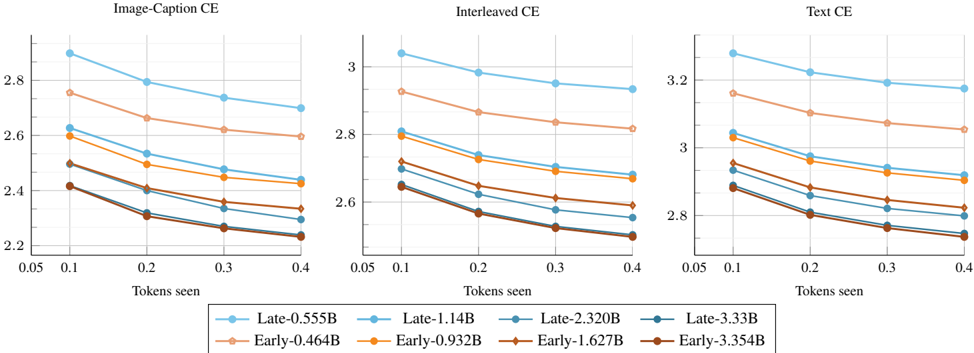
The image presents three line charts comparing the cross-entropy (CE) loss against the number of tokens seen during training for different training strategies. The charts are titled "Image-Caption CE," "Interleaved CE," and "Text CE," representing different training data compositions. Each chart plots the CE loss for models trained with "Early" and "Late" strategies, further differentiated by the number of parameters (0.464B to 3.354B). The x-axis represents "Tokens seen," ranging from 0.05 to 0.4, while the y-axis represents the CE loss.
### Components/Axes
* **Titles:**
* Left Chart: Image-Caption CE
* Middle Chart: Interleaved CE
* Right Chart: Text CE
* **X-axis:**
* Label: Tokens seen
* Scale: 0.05, 0.1, 0.2, 0.3, 0.4
* **Y-axis:**
* Left Chart Scale: 2.2, 2.4, 2.6, 2.8
* Middle Chart Scale: 2.6, 2.8, 3
* Right Chart Scale: 2.8, 3, 3.2
* **Legend:** Located at the bottom of the image, applies to all three charts.
* Blue (circle markers): Late-0.555B
* Light Blue (circle markers): Late-1.14B
* Teal (circle markers): Late-2.320B
* Dark Teal (circle markers): Late-3.33B
* Light Orange (diamond markers): Early-0.464B
* Orange (diamond markers): Early-0.932B
* Brown (diamond markers): Early-1.627B
* Dark Brown (diamond markers): Early-3.354B
### Detailed Analysis
**Image-Caption CE (Left Chart):**
* **Late-0.555B (Blue, circle markers):** Decreases from approximately 2.92 at 0.05 tokens to 2.72 at 0.4 tokens.
* **Late-1.14B (Light Blue, circle markers):** Decreases from approximately 2.75 at 0.05 tokens to 2.58 at 0.4 tokens.
* **Late-2.320B (Teal, circle markers):** Decreases from approximately 2.62 at 0.05 tokens to 2.45 at 0.4 tokens.
* **Late-3.33B (Dark Teal, circle markers):** Decreases from approximately 2.5 at 0.05 tokens to 2.3 at 0.4 tokens.
* **Early-0.464B (Light Orange, diamond markers):** Decreases from approximately 2.75 at 0.05 tokens to 2.65 at 0.4 tokens.
* **Early-0.932B (Orange, diamond markers):** Decreases from approximately 2.6 at 0.05 tokens to 2.5 at 0.4 tokens.
* **Early-1.627B (Brown, diamond markers):** Decreases from approximately 2.42 at 0.05 tokens to 2.3 at 0.4 tokens.
* **Early-3.354B (Dark Brown, diamond markers):** Decreases from approximately 2.4 at 0.05 tokens to 2.25 at 0.4 tokens.
**Interleaved CE (Middle Chart):**
* **Late-0.555B (Blue, circle markers):** Decreases from approximately 3.05 at 0.05 tokens to 2.85 at 0.4 tokens.
* **Late-1.14B (Light Blue, circle markers):** Decreases from approximately 2.9 at 0.05 tokens to 2.7 at 0.4 tokens.
* **Late-2.320B (Teal, circle markers):** Decreases from approximately 2.75 at 0.05 tokens to 2.6 at 0.4 tokens.
* **Late-3.33B (Dark Teal, circle markers):** Decreases from approximately 2.65 at 0.05 tokens to 2.5 at 0.4 tokens.
* **Early-0.464B (Light Orange, diamond markers):** Decreases from approximately 2.9 at 0.05 tokens to 2.8 at 0.4 tokens.
* **Early-0.932B (Orange, diamond markers):** Decreases from approximately 2.8 at 0.05 tokens to 2.7 at 0.4 tokens.
* **Early-1.627B (Brown, diamond markers):** Decreases from approximately 2.65 at 0.05 tokens to 2.55 at 0.4 tokens.
* **Early-3.354B (Dark Brown, diamond markers):** Decreases from approximately 2.65 at 0.05 tokens to 2.5 at 0.4 tokens.
**Text CE (Right Chart):**
* **Late-0.555B (Blue, circle markers):** Decreases from approximately 3.3 at 0.05 tokens to 3.1 at 0.4 tokens.
* **Late-1.14B (Light Blue, circle markers):** Decreases from approximately 3.15 at 0.05 tokens to 2.95 at 0.4 tokens.
* **Late-2.320B (Teal, circle markers):** Decreases from approximately 3.0 at 0.05 tokens to 2.85 at 0.4 tokens.
* **Late-3.33B (Dark Teal, circle markers):** Decreases from approximately 2.9 at 0.05 tokens to 2.75 at 0.4 tokens.
* **Early-0.464B (Light Orange, diamond markers):** Decreases from approximately 3.2 at 0.05 tokens to 3.1 at 0.4 tokens.
* **Early-0.932B (Orange, diamond markers):** Decreases from approximately 3.05 at 0.05 tokens to 2.95 at 0.4 tokens.
* **Early-1.627B (Brown, diamond markers):** Decreases from approximately 2.9 at 0.05 tokens to 2.8 at 0.4 tokens.
* **Early-3.354B (Dark Brown, diamond markers):** Decreases from approximately 2.85 at 0.05 tokens to 2.7 at 0.4 tokens.
### Key Observations
* In all three charts, the CE loss decreases as the number of tokens seen increases, indicating that the models are learning.
* For both "Early" and "Late" strategies, models with more parameters (higher B value) generally have lower CE loss, suggesting better performance.
* The "Text CE" chart shows the highest CE loss values, followed by "Interleaved CE," and then "Image-Caption CE," indicating that training on text alone might be more challenging than training with image-caption pairs or interleaved data.
* The "Late" training strategy generally results in higher CE loss compared to the "Early" strategy for the same number of parameters and tokens seen.
### Interpretation
The charts demonstrate the impact of training strategy (Early vs. Late), model size (number of parameters), and training data composition (Image-Caption, Interleaved, Text) on the cross-entropy loss during model training. The consistent downward trend of all lines indicates that the models are learning from the data. The lower CE loss for larger models suggests that increasing model capacity improves performance. The differences in CE loss across the three charts highlight the importance of the training data composition, with image-caption pairs potentially providing a more effective training signal than text alone. The "Late" training strategy's higher CE loss could indicate a slower or less efficient learning process compared to the "Early" strategy.