\n
## Line Chart: Cross-Entropy Loss vs. Tokens Seen for Different Models
### Overview
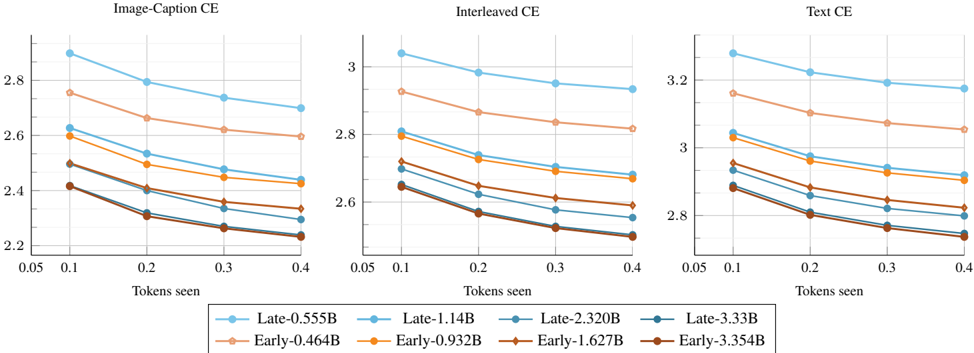
This image presents three line charts, each depicting the cross-entropy (CE) loss as a function of "Tokens seen". Each chart represents a different data type: "Image-Caption CE", "Interleaved CE", and "Text CE". Each chart contains data for six different models, distinguished by name and size (in billions of parameters - B). The charts aim to compare the learning curves of these models across different data modalities.
### Components/Axes
* **X-axis:** "Tokens seen", ranging from 0.05 to 0.4, with markers at 0.05, 0.1, 0.2, 0.3, and 0.4.
* **Y-axis:** "Cross-Entropy Loss" (CE). The scales vary for each chart:
* Image-Caption CE: approximately 2.2 to 2.9
* Interleaved CE: approximately 2.5 to 3.1
* Text CE: approximately 2.7 to 3.4
* **Legend:** Located at the bottom of each chart, identifying the six models:
* Late-0.555B (light blue)
* Late-1.14B (blue)
* Late-2.320B (dark blue)
* Late-3.354B (teal)
* Early-0.464B (light orange)
* Early-0.932B (orange)
* Early-1.672B (dark orange)
* Early-3.54B (red)
### Detailed Analysis or Content Details
**Image-Caption CE Chart:**
* **Late-0.555B (light blue):** Starts at approximately 2.85 and decreases to approximately 2.45.
* **Late-1.14B (blue):** Starts at approximately 2.75 and decreases to approximately 2.35.
* **Late-2.320B (dark blue):** Starts at approximately 2.65 and decreases to approximately 2.25.
* **Late-3.354B (teal):** Starts at approximately 2.6 and decreases to approximately 2.2.
* **Early-0.464B (light orange):** Starts at approximately 2.8 and decreases to approximately 2.5.
* **Early-0.932B (orange):** Starts at approximately 2.7 and decreases to approximately 2.4.
* **Early-1.672B (dark orange):** Starts at approximately 2.6 and decreases to approximately 2.3.
* **Early-3.54B (red):** Starts at approximately 2.55 and decreases to approximately 2.2.
**Interleaved CE Chart:**
* **Late-0.555B (light blue):** Starts at approximately 2.95 and decreases to approximately 2.65.
* **Late-1.14B (blue):** Starts at approximately 2.9 and decreases to approximately 2.6.
* **Late-2.320B (dark blue):** Starts at approximately 2.85 and decreases to approximately 2.55.
* **Late-3.354B (teal):** Starts at approximately 2.8 and decreases to approximately 2.5.
* **Early-0.464B (light orange):** Starts at approximately 2.9 and decreases to approximately 2.6.
* **Early-0.932B (orange):** Starts at approximately 2.85 and decreases to approximately 2.55.
* **Early-1.672B (dark orange):** Starts at approximately 2.8 and decreases to approximately 2.5.
* **Early-3.54B (red):** Starts at approximately 2.75 and decreases to approximately 2.45.
**Text CE Chart:**
* **Late-0.555B (light blue):** Starts at approximately 3.15 and decreases to approximately 2.9.
* **Late-1.14B (blue):** Starts at approximately 3.1 and decreases to approximately 2.85.
* **Late-2.320B (dark blue):** Starts at approximately 3.05 and decreases to approximately 2.8.
* **Late-3.354B (teal):** Starts at approximately 3.0 and decreases to approximately 2.75.
* **Early-0.464B (light orange):** Starts at approximately 3.2 and decreases to approximately 2.95.
* **Early-0.932B (orange):** Starts at approximately 3.15 and decreases to approximately 2.9.
* **Early-1.672B (dark orange):** Starts at approximately 3.1 and decreases to approximately 2.85.
* **Early-3.54B (red):** Starts at approximately 3.05 and decreases to approximately 2.8.
### Key Observations
* In all three charts, the loss generally decreases as the number of tokens seen increases, indicating learning.
* Larger models (higher B values) consistently exhibit lower loss values across all data types.
* The "Late" models generally perform better than the "Early" models for a given size.
* The rate of loss decrease appears to slow down as the number of tokens seen increases, suggesting diminishing returns.
* The "Text CE" chart shows the highest overall loss values compared to the other two charts.
### Interpretation
The charts demonstrate the impact of model size and training data type on cross-entropy loss. The consistent trend of decreasing loss with increasing tokens seen confirms that the models are learning from the data. The superior performance of larger models suggests that increased model capacity allows for better representation of the underlying data distributions. The difference in loss values between the data types (Image-Caption, Interleaved, Text) indicates that the models find some data types easier to learn than others, with "Text CE" being the most challenging in this case. The distinction between "Early" and "Late" models suggests that the training procedure or initialization strategy used for the "Late" models is more effective. The flattening of the learning curves at higher token counts suggests that further training may yield only marginal improvements. The data suggests that model size is a significant factor in performance, but the choice of data type and training methodology also play crucial roles.