TECHNICAL ASSET FINGERPRINT
23b7d6012b72a43b5075a715
Click to view fullscreen
Press ESC or click to close
FOUND IN PAPERS
EXPERT: healer-alpha-free VERSION 1
RUNTIME: free/openrouter/healer-alpha
INTEL_VERIFIED
## Line Charts: Cross-Entropy Loss vs. Tokens Seen for Various Model Sizes
### Overview
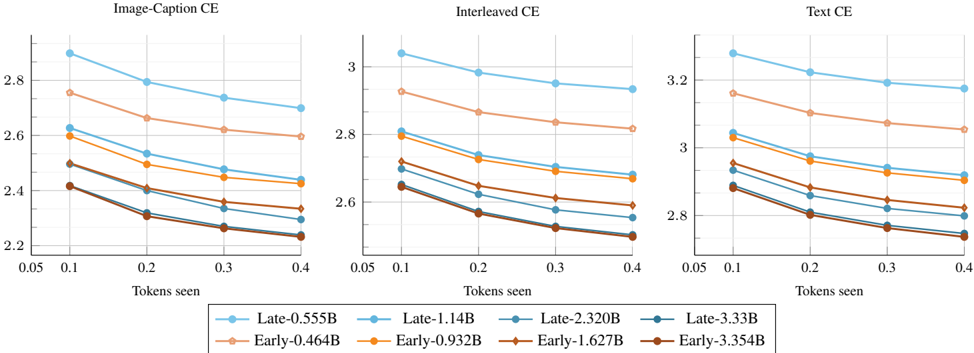
The image displays three line charts arranged horizontally, comparing the performance of different model variants across three distinct evaluation settings: "Image-Caption CE", "Interleaved CE", and "Text CE". Each chart plots Cross-Entropy (CE) loss on the y-axis against the number of "Tokens seen" on the x-axis. The data suggests an analysis of model training or evaluation efficiency, showing how loss decreases as models are exposed to more data.
### Components/Axes
* **Titles (Top of each chart):**
* Left Chart: `Image-Caption CE`
* Middle Chart: `Interleaved CE`
* Right Chart: `Text CE`
* **X-Axis (All charts):** Label: `Tokens seen`. Scale: Linear, with major tick marks at `0.05`, `0.1`, `0.2`, `0.3`, and `0.4`.
* **Y-Axis (All charts):** Represents Cross-Entropy loss. The scale varies per chart:
* Left Chart (`Image-Caption CE`): Ranges approximately from `2.2` to `2.9`.
* Middle Chart (`Interleaved CE`): Ranges approximately from `2.5` to `3.1`.
* Right Chart (`Text CE`): Ranges approximately from `2.7` to `3.3`.
* **Legend (Bottom, spanning all charts):** Contains 8 entries, each with a unique color and marker symbol. The entries are:
1. `Late-0.555B` (Light blue line, circle marker)
2. `Late-1.14B` (Medium blue line, circle marker)
3. `Late-2.320B` (Dark blue line, circle marker)
4. `Late-3.33B` (Very dark blue/black line, circle marker)
5. `Early-0.464B` (Light orange line, diamond marker)
6. `Early-0.932B` (Medium orange line, diamond marker)
7. `Early-1.627B` (Dark orange/brown line, diamond marker)
8. `Early-3.354B` (Very dark brown line, diamond marker)
### Detailed Analysis
**Chart 1: Image-Caption CE (Left)**
* **Trend:** All eight lines show a consistent downward slope from left to right, indicating that CE loss decreases as the number of tokens seen increases.
* **Data Series & Approximate Values (at x=0.1 and x=0.4):**
* `Late-0.555B`: Starts highest at ~2.9 (x=0.1), ends at ~2.7 (x=0.4).
* `Early-0.464B`: Starts at ~2.75, ends at ~2.6.
* `Late-1.14B`: Starts at ~2.62, ends at ~2.45.
* `Early-0.932B`: Starts at ~2.58, ends at ~2.42.
* `Late-2.320B`: Starts at ~2.5, ends at ~2.35.
* `Early-1.627B`: Starts at ~2.42, ends at ~2.3.
* `Late-3.33B`: Starts at ~2.42, ends at ~2.28.
* `Early-3.354B`: Starts lowest at ~2.41, ends lowest at ~2.23.
* **Pattern:** Lines are clearly stratified by model size, with larger models (e.g., 3.33B, 3.354B) consistently achieving lower loss than smaller models (e.g., 0.555B, 0.464B). For a given approximate model size, the "Early" variant (diamond) consistently has slightly lower loss than the "Late" variant (circle).
**Chart 2: Interleaved CE (Middle)**
* **Trend:** Similar consistent downward slope for all lines.
* **Data Series & Approximate Values (at x=0.1 and x=0.4):**
* `Late-0.555B`: Starts highest at ~3.05, ends at ~2.95.
* `Early-0.464B`: Starts at ~2.92, ends at ~2.82.
* `Late-1.14B`: Starts at ~2.8, ends at ~2.7.
* `Early-0.932B`: Starts at ~2.78, ends at ~2.68.
* `Late-2.320B`: Starts at ~2.7, ends at ~2.6.
* `Early-1.627B`: Starts at ~2.65, ends at ~2.58.
* `Late-3.33B`: Starts at ~2.64, ends at ~2.55.
* `Early-3.354B`: Starts lowest at ~2.63, ends lowest at ~2.5.
* **Pattern:** The same stratification by size and "Early"/"Late" variant is present. The overall loss values are higher than in the "Image-Caption CE" chart.
**Chart 3: Text CE (Right)**
* **Trend:** Consistent downward slope for all lines.
* **Data Series & Approximate Values (at x=0.1 and x=0.4):**
* `Late-0.555B`: Starts highest at ~3.3, ends at ~3.18.
* `Early-0.464B`: Starts at ~3.15, ends at ~3.05.
* `Late-1.14B`: Starts at ~3.05, ends at ~2.92.
* `Early-0.932B`: Starts at ~3.02, ends at ~2.9.
* `Late-2.320B`: Starts at ~2.95, ends at ~2.85.
* `Early-1.627B`: Starts at ~2.9, ends at ~2.8.
* `Late-3.33B`: Starts at ~2.88, ends at ~2.78.
* `Early-3.354B`: Starts lowest at ~2.87, ends lowest at ~2.72.
* **Pattern:** Maintains the established stratification. This chart shows the highest overall loss values of the three evaluation settings.
### Key Observations
1. **Universal Improvement with Scale:** Across all three evaluation settings, increasing the number of "Tokens seen" leads to a monotonic decrease in Cross-Entropy loss for every model variant.
2. **Clear Model Size Hierarchy:** There is a strict performance hierarchy based on model parameter count (the number in the label, e.g., 0.555B, 3.354B). Larger models consistently achieve lower loss at every data point.
3. **"Early" vs. "Late" Consistency:** For models of comparable size (e.g., ~0.5B, ~1B, ~2B, ~3.3B), the "Early" variant (orange/brown, diamond markers) consistently outperforms the "Late" variant (blue, circle markers) by a small but visible margin across all charts and all token counts.
4. **Task Difficulty Gradient:** The absolute loss values suggest a gradient of task difficulty or model suitability. Loss is lowest for `Image-Caption CE`, intermediate for `Interleaved CE`, and highest for `Text CE`. This implies the models find the pure text task (`Text CE`) the most challenging among the three.
### Interpretation
This visualization provides a technical comparison of model training dynamics. The data demonstrates two fundamental principles of machine learning: **scaling laws** (larger models perform better) and the **benefit of more training data** (loss decreases with more tokens seen). The consistent superiority of "Early" over "Late" variants suggests a meaningful architectural or training difference between these two families, where the "Early" design is more data-efficient or has a better inductive bias for these tasks.
The variation in loss across the three charts (`Image-Caption` < `Interleaved` < `Text`) is particularly insightful. It suggests that the models' pre-training or architecture may be more aligned with multimodal (image-text) tasks than pure text tasks. The `Interleaved CE` setting, which likely involves mixed image-text sequences, shows performance between the other two, supporting this hypothesis. This kind of analysis is crucial for understanding model capabilities and guiding future development toward specific task domains.
DECODING INTELLIGENCE...