## Line Chart: Spearman Correlation vs. Model Size for LLaMA vs. OPT/GPT-J/NeoX
### Overview
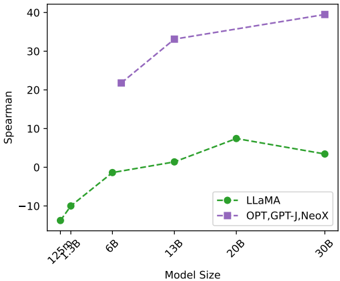
This is a line chart comparing the performance, measured by Spearman correlation, of two groups of large language models (LLMs) as a function of their parameter count (Model Size). The chart shows that the group containing OPT, GPT-J, and NeoX consistently achieves a higher Spearman score than LLaMA across all comparable model sizes, with both groups generally showing improved performance as model size increases.
### Components/Axes
* **Chart Type:** Line chart with markers.
* **X-Axis (Horizontal):**
* **Label:** "Model Size"
* **Scale:** Categorical, representing discrete model sizes in billions (B) and millions (M) of parameters.
* **Tick Labels (from left to right):** "125M", "350M", "1B", "6B", "13B", "20B", "30B". The labels are rotated approximately 45 degrees.
* **Y-Axis (Vertical):**
* **Label:** "Spearman"
* **Scale:** Linear numerical scale.
* **Range:** Approximately -15 to 40.
* **Major Tick Marks:** -10, 0, 10, 20, 30, 40.
* **Legend:**
* **Position:** Bottom-right corner of the plot area.
* **Series 1:** Label "LLaMA", represented by a green dashed line with circular markers (●).
* **Series 2:** Label "OPT,GPT-J,NeoX", represented by a purple dashed line with square markers (■).
### Detailed Analysis
**Data Series 1: LLaMA (Green dashed line, circle markers)**
* **Trend:** The line shows a general upward trend from 125M to 20B parameters, followed by a slight decrease at 30B.
* **Data Points (Approximate):**
* 125M: ~ -15
* 350M: ~ -10
* 1B: ~ -2
* 6B: ~ 0
* 13B: ~ 1
* 20B: ~ 7 (Peak for this series)
* 30B: ~ 3
**Data Series 2: OPT, GPT-J, NeoX (Purple dashed line, square markers)**
* **Trend:** The line shows a consistent, steep upward trend across all plotted model sizes.
* **Data Points (Approximate):**
* 1B: ~ 21
* 6B: ~ 33
* 13B: ~ 35
* 30B: ~ 39 (Highest point on the chart)
### Key Observations
1. **Performance Gap:** There is a significant and consistent performance gap between the two groups. The "OPT,GPT-J,NeoX" group's Spearman scores are substantially higher than LLaMA's at every shared model size (1B, 6B, 13B, 30B).
2. **Scaling Behavior:** Both groups demonstrate that increasing model size generally correlates with improved Spearman performance. However, the rate of improvement (slope) is much steeper for the "OPT,GPT-J,NeoX" group.
3. **LLaMA's Peak and Dip:** The LLaMA series peaks at the 20B parameter size before showing a slight regression at 30B. This could indicate a point of diminishing returns or a specific characteristic of the 30B LLaMA model in this evaluation.
4. **Data Availability:** The "OPT,GPT-J,NeoX" series does not have data points for the smallest model sizes (125M, 350M), while LLaMA has data across the full range.
### Interpretation
The chart suggests a fundamental difference in the scaling efficiency or training methodology between the LLaMA model family and the combined group of OPT, GPT-J, and NeoX models, as measured by the Spearman correlation metric. The Spearman rank correlation coefficient assesses how well the relationship between two variables can be described using a monotonic function. In the context of LLM evaluation, this often relates to the model's ability to rank outputs or align with human preferences.
The data implies that for a given number of parameters, the OPT/GPT-J/NeoX architectures (or their training regimes) yield models with a stronger monotonic relationship to the evaluation target than LLaMA. The consistent upward trend for both groups reinforces the well-established "scaling laws" principle in AI, where larger models tend to perform better. However, the diverging slopes indicate that not all model families scale equally effectively on this specific metric. The slight downturn for LLaMA at 30B is an anomaly worth investigating—it could be due to training instability, data differences, or an artifact of the specific evaluation task.