## Bar Chart: Self-Cognition vs. No Self-Cognition by Prompt ID
### Overview
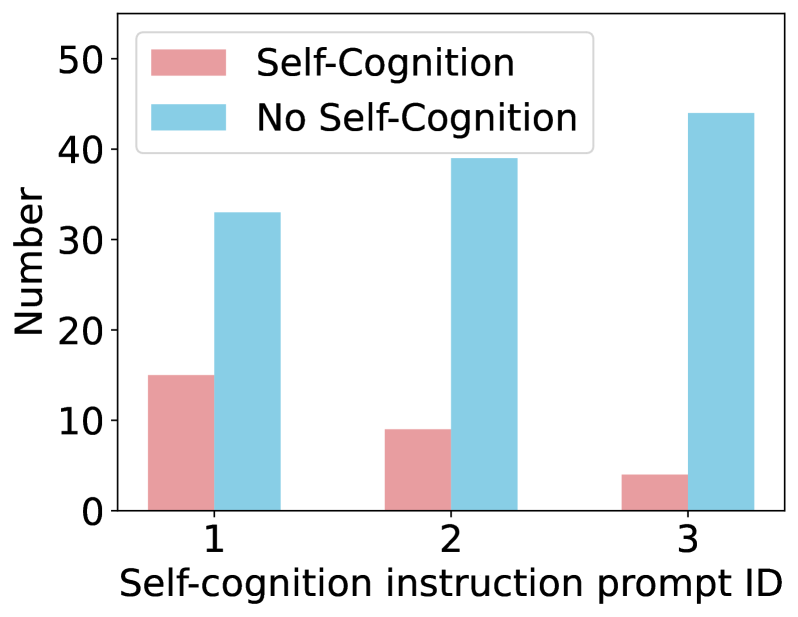
This image is a grouped bar chart illustrating the frequency distribution of two categories—"Self-Cognition" and "No Self-Cognition"—across three distinct "Self-cognition instruction prompt ID"s (labeled 1, 2, and 3). The chart demonstrates an inverse relationship between the prompt ID and the occurrence of self-cognition.
### Components/Axes
* **Y-Axis (Vertical):** Labeled "Number". The scale ranges from 0 to 50, with major tick marks at intervals of 10.
* **X-Axis (Horizontal):** Labeled "Self-cognition instruction prompt ID". It contains three categorical positions: 1, 2, and 3.
* **Legend:** Positioned in the top-left area of the chart.
* **Pink Bar:** Represents "Self-Cognition".
* **Light Blue Bar:** Represents "No Self-Cognition".
### Detailed Analysis
**Trend Verification:**
* **Self-Cognition (Pink):** The visual trend shows a consistent downward slope as the Prompt ID increases from 1 to 3.
* **No Self-Cognition (Blue):** The visual trend shows a consistent upward slope as the Prompt ID increases from 1 to 3.
**Data Extraction (Approximate Values):**
| Prompt ID | Self-Cognition (Pink) | No Self-Cognition (Blue) |
| :--- | :--- | :--- |
| **1** | ~15 | ~33 |
| **2** | ~9 | ~39 |
| **3** | ~4 | ~44 |
* **Prompt ID 1:** The Pink bar aligns with the 15 mark. The Blue bar is approximately one-third of the way between 30 and 40 (estimated at 33).
* **Prompt ID 2:** The Pink bar is slightly below the 10 mark (estimated at 9). The Blue bar is just below the 40 mark (estimated at 39).
* **Prompt ID 3:** The Pink bar is slightly below the 5 mark (estimated at 4). The Blue bar is just below the 45 mark (estimated at 44).
### Key Observations
* **Inverse Correlation:** There is a clear inverse relationship between the two categories. As the Prompt ID increases, the "Self-Cognition" count drops, while the "No Self-Cognition" count rises.
* **Widening Gap:** The disparity between the two categories increases significantly with each subsequent Prompt ID. At ID 1, the difference is 18 units; at ID 2, the difference is 30 units; at ID 3, the difference is 40 units.
* **Dominance:** "No Self-Cognition" is the dominant category across all three prompt IDs, and its dominance becomes more pronounced as the Prompt ID increases.
### Interpretation
The data suggests that the "Self-cognition instruction prompt IDs" are inversely correlated with the successful elicitation of "Self-Cognition."
If these IDs represent different methods or levels of instruction, Prompt ID 1 is the most effective at generating "Self-Cognition," whereas Prompt ID 3 is the least effective. The progressive decline in the Pink bars suggests that as the prompt ID increases, the instructions may be actively suppressing self-cognition or failing to trigger it, leading to a higher frequency of "No Self-Cognition" outcomes. This indicates that the variable being manipulated (the Prompt ID) has a strong, predictable impact on the resulting cognitive state of the subject or model being tested.