\n
## Diagram: Process Flow with Hazard and Success Indicators
### Overview
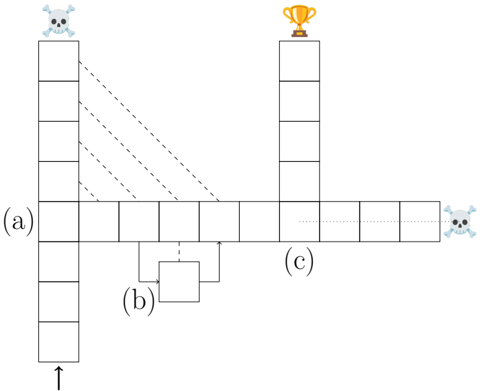
The image is a schematic diagram illustrating a process flow or system architecture. It uses a grid-based layout with squares representing steps or states, connected by lines indicating relationships or transitions. The diagram includes symbolic icons (skull and crossbones, trophy) to denote hazardous/failure points and a successful outcome, respectively. Three main components are labeled (a), (b), and (c).
### Components/Axes
* **Primary Structure:** A grid of empty squares arranged in a cross-like formation.
* **Icons:**
* **Top-Left:** A skull and crossbones icon positioned above the top of a vertical column of squares.
* **Top-Right:** A trophy icon positioned above the top of a separate vertical column of squares.
* **Far-Right:** A second skull and crossbones icon at the end of a horizontal row.
* **Labels:**
* **(a):** Labels a horizontal row of squares extending to the right from a vertical column.
* **(b):** Labels a single square positioned below the horizontal row (a).
* **(c):** Labels a vertical column of squares positioned to the right of the horizontal row.
* **Connectors:**
* **Solid Lines:** Connect squares vertically and horizontally, indicating direct flow or connection.
* **Dashed Lines:** Four diagonal dashed lines connect the top of the left vertical column to the first four squares of the horizontal row (a).
* **Dotted Line:** A horizontal dotted line runs through the center of the vertical column labeled (c).
* **Directional Indicator:** An upward-pointing arrow is located at the bottom of the leftmost vertical column.
### Detailed Analysis
The diagram is segmented into three primary regions:
1. **Left Vertical Column & Component (a):**
* A vertical stack of 7 squares. An arrow at the bottom points upward into this column.
* The top of this column is marked with a skull and crossbones icon.
* From the top four squares of this column, four diagonal dashed lines extend downward and to the right, connecting to the first four squares of the horizontal row labeled **(a)**.
* Row **(a)** consists of 8 squares in total, extending horizontally to the right.
2. **Component (b):**
* A single square is positioned directly below the 4th and 5th squares of row **(a)**.
* It is connected to these two squares above it by solid vertical lines, forming a "U" shape or a merge/join point.
3. **Component (c) & Right Side:**
* A vertical column of 5 squares is positioned to the right of row **(a)**, starting from its 6th square.
* The top of this column is marked with a trophy icon.
* A horizontal dotted line runs through the center of this column, extending left into row **(a)** and right to the final skull and crossbones icon.
* The horizontal row continues for 3 more squares to the right of column **(c)**, terminating at the second skull and crossbones icon.
### Key Observations
* **Dual Outcomes:** The diagram explicitly shows two potential endpoints: a trophy (success) at the top of column (c) and two skull and crossbones icons (failure/hazard) at the start of the left column and the end of the rightward path.
* **Convergent Path:** Component (b) acts as a convergence point, merging two streams from row (a) into a single step.
* **Parallel Structures:** The left and right vertical columns are parallel but distinct, with the left being the entry point (arrow) and the right being a potential success endpoint.
* **Line Type Semantics:** The use of different line styles (solid, dashed, dotted) suggests different types of relationships or transitions (e.g., direct flow, dependency, background process).
### Interpretation
This diagram likely models a **process, workflow, or decision tree with inherent risks and a defined goal**. The left column represents the initiation of a process, which is inherently hazardous (skull icon). The dashed lines suggest that early stages of this process feed into or influence the main operational sequence represented by row (a).
Component (b) represents a critical integration or decision point where two aspects of the process are combined. The path then continues toward column (c), which symbolizes the successful completion or goal (trophy). However, the process can also diverge from this successful path, as indicated by the continuation of the row to the right, which ends in another failure state (skull icon). The dotted line through (c) may represent a monitoring, control, or background process that runs parallel to the main success path.
The overall message is that the process begins in a risky state, navigates through a series of steps with a key integration point, and has a chance of achieving success, but also carries the risk of failure even after passing the success-associated component. It visually emphasizes that success and failure are distinct endpoints within the same system.