## Chart: LM Loss vs. PFLOP/s-days for MoBA and Full Attention Projections
### Overview
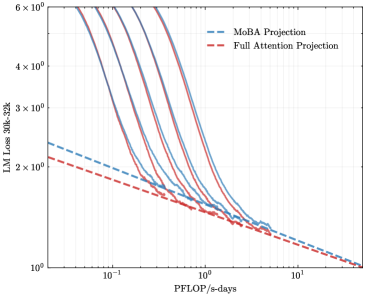
The image is a log-log plot comparing the language modeling (LM) loss of MoBA Projection and Full Attention Projection models against the computational cost in PFLOP/s-days. The plot shows multiple runs for the MoBA Projection, illustrating its variability, while a single run is shown for the Full Attention Projection.
### Components/Axes
* **X-axis:** PFLOP/s-days (log scale), ranging from approximately 0.03 to 10. Axis markers are at 0.1, 1, and 10.
* **Y-axis:** LM Loss 30k-32k (log scale), ranging from approximately 1 to 6 x 10^0. Axis markers are at 2 x 10^0, 3 x 10^0, 4 x 10^0, and 6 x 10^0.
* **Legend (top-left):**
* Blue dashed line: MoBA Projection
* Red dashed line: Full Attention Projection
### Detailed Analysis
* **MoBA Projection (Blue):** There are multiple blue lines, indicating several runs.
* **Trend:** Each line generally slopes downward, indicating decreasing LM loss with increasing PFLOP/s-days.
* **Values:**
* At 0.1 PFLOP/s-days, the LM loss ranges from approximately 3.5 x 10^0 to 5 x 10^0 across the different runs.
* At 1 PFLOP/s-days, the LM loss ranges from approximately 1.5 x 10^0 to 2 x 10^0.
* At 10 PFLOP/s-days, the LM loss converges to approximately 1.2 x 10^0.
* **Full Attention Projection (Red):** There is a single red line.
* **Trend:** The line slopes downward, indicating decreasing LM loss with increasing PFLOP/s-days.
* **Values:**
* At 0.1 PFLOP/s-days, the LM loss is approximately 2.2 x 10^0.
* At 1 PFLOP/s-days, the LM loss is approximately 1.4 x 10^0.
* At 10 PFLOP/s-days, the LM loss is approximately 1.1 x 10^0.
### Key Observations
* The MoBA Projection exhibits more variability in LM loss compared to the Full Attention Projection, as indicated by the multiple runs.
* Both projections show a decrease in LM loss as the computational cost (PFLOP/s-days) increases.
* At lower computational costs (e.g., 0.1 PFLOP/s-days), the MoBA Projection can have a higher LM loss than the Full Attention Projection.
* At higher computational costs (e.g., 10 PFLOP/s-days), the LM loss for both projections converges to a similar value.
### Interpretation
The data suggests that while the Full Attention Projection provides a more consistent reduction in LM loss with increasing computational cost, the MoBA Projection can achieve comparable performance at higher computational budgets, albeit with more variability. The multiple runs of MoBA Projection highlight the importance of hyperparameter tuning and potential instability in the training process. The convergence of both projections at higher PFLOP/s-days indicates that both models can achieve similar levels of performance given sufficient computational resources. The choice between the two may depend on the desired level of consistency and the available computational budget.