\n
## Chart: LM Loss vs. PFLOP/s-days
### Overview
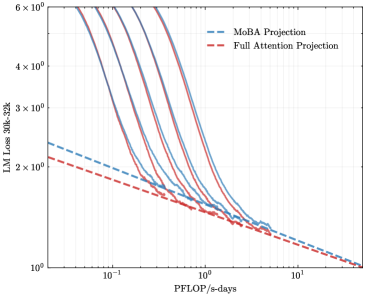
The image presents a line chart comparing the LM Loss (Language Model Loss) of two projection methods – MoBA Projection and Full Attention Projection – as a function of PFLOP/s-days (Peta Floating Point Operations per second-days). Multiple lines are shown for each projection method, likely representing different runs or configurations. The chart uses a logarithmic scale for both the y-axis (LM Loss) and the x-axis (PFLOP/s-days).
### Components/Axes
* **X-axis:** PFLOP/s-days, ranging from approximately 10<sup>-1</sup> to 10<sup>1</sup> (logarithmic scale).
* **Y-axis:** LM Loss 30k-32k, ranging from approximately 10<sup>0</sup> to 6 x 10<sup>6</sup> (logarithmic scale).
* **Legend:** Located in the top-right corner.
* MoBA Projection (Blue dashed lines)
* Full Attention Projection (Red solid lines)
* **Data Series:** Multiple lines for each projection method. There are approximately 6 lines for each method.
### Detailed Analysis
**MoBA Projection (Blue dashed lines):**
The MoBA Projection lines generally slope downward, indicating that as PFLOP/s-days increase, the LM Loss decreases. The lines start at varying points on the y-axis, but converge as PFLOP/s-days increase.
* Line 1: Starts at approximately 3 x 10<sup>6</sup> LM Loss at 10<sup>-1</sup> PFLOP/s-days, decreasing to approximately 10<sup>1</sup> LM Loss at 10<sup>1</sup> PFLOP/s-days.
* Line 2: Starts at approximately 2 x 10<sup>6</sup> LM Loss at 10<sup>-1</sup> PFLOP/s-days, decreasing to approximately 10<sup>1</sup> LM Loss at 10<sup>1</sup> PFLOP/s-days.
* Line 3: Starts at approximately 1.5 x 10<sup>6</sup> LM Loss at 10<sup>-1</sup> PFLOP/s-days, decreasing to approximately 10<sup>1</sup> LM Loss at 10<sup>1</sup> PFLOP/s-days.
* Line 4: Starts at approximately 1 x 10<sup>6</sup> LM Loss at 10<sup>-1</sup> PFLOP/s-days, decreasing to approximately 10<sup>1</sup> LM Loss at 10<sup>1</sup> PFLOP/s-days.
* Line 5: Starts at approximately 5 x 10<sup>5</sup> LM Loss at 10<sup>-1</sup> PFLOP/s-days, decreasing to approximately 10<sup>1</sup> LM Loss at 10<sup>1</sup> PFLOP/s-days.
* Line 6: Starts at approximately 3 x 10<sup>5</sup> LM Loss at 10<sup>-1</sup> PFLOP/s-days, decreasing to approximately 10<sup>1</sup> LM Loss at 10<sup>1</sup> PFLOP/s-days.
**Full Attention Projection (Red solid lines):**
The Full Attention Projection lines also slope downward, showing a decrease in LM Loss with increasing PFLOP/s-days. These lines generally start at lower LM Loss values than the MoBA Projection lines and also converge as PFLOP/s-days increase.
* Line 1: Starts at approximately 2 x 10<sup>6</sup> LM Loss at 10<sup>-1</sup> PFLOP/s-days, decreasing to approximately 10<sup>0</sup> LM Loss at 10<sup>1</sup> PFLOP/s-days.
* Line 2: Starts at approximately 1.5 x 10<sup>6</sup> LM Loss at 10<sup>-1</sup> PFLOP/s-days, decreasing to approximately 10<sup>0</sup> LM Loss at 10<sup>1</sup> PFLOP/s-days.
* Line 3: Starts at approximately 1 x 10<sup>6</sup> LM Loss at 10<sup>-1</sup> PFLOP/s-days, decreasing to approximately 10<sup>0</sup> LM Loss at 10<sup>1</sup> PFLOP/s-days.
* Line 4: Starts at approximately 5 x 10<sup>5</sup> LM Loss at 10<sup>-1</sup> PFLOP/s-days, decreasing to approximately 10<sup>0</sup> LM Loss at 10<sup>1</sup> PFLOP/s-days.
* Line 5: Starts at approximately 3 x 10<sup>5</sup> LM Loss at 10<sup>-1</sup> PFLOP/s-days, decreasing to approximately 10<sup>0</sup> LM Loss at 10<sup>1</sup> PFLOP/s-days.
* Line 6: Starts at approximately 2 x 10<sup>5</sup> LM Loss at 10<sup>-1</sup> PFLOP/s-days, decreasing to approximately 10<sup>0</sup> LM Loss at 10<sup>1</sup> PFLOP/s-days.
### Key Observations
* Full Attention Projection consistently achieves lower LM Loss values than MoBA Projection across the entire range of PFLOP/s-days.
* The multiple lines for each projection method suggest variability in performance, potentially due to different initialization, hyperparameters, or data subsets.
* The convergence of lines for both methods at higher PFLOP/s-days indicates diminishing returns in terms of LM Loss reduction as computational resources increase.
### Interpretation
The chart demonstrates the trade-off between computational cost (PFLOP/s-days) and model performance (LM Loss). Full Attention Projection appears to be more efficient in achieving lower LM Loss for a given amount of computation compared to MoBA Projection. However, both methods exhibit a decreasing rate of improvement as PFLOP/s-days increase, suggesting that there is a point of diminishing returns. The spread of lines within each method indicates that the performance is not deterministic and can vary. This could be due to the stochastic nature of training deep learning models. The logarithmic scales on both axes highlight the significant changes in both LM Loss and PFLOP/s-days, and the chart effectively visualizes the relationship between these two key metrics. The data suggests that while increasing computational resources can improve model performance, the benefits may become marginal beyond a certain point, and the choice of projection method significantly impacts efficiency.