## Object Detection Screenshot: Aerial Bridge View with Confidence Scores
### Overview
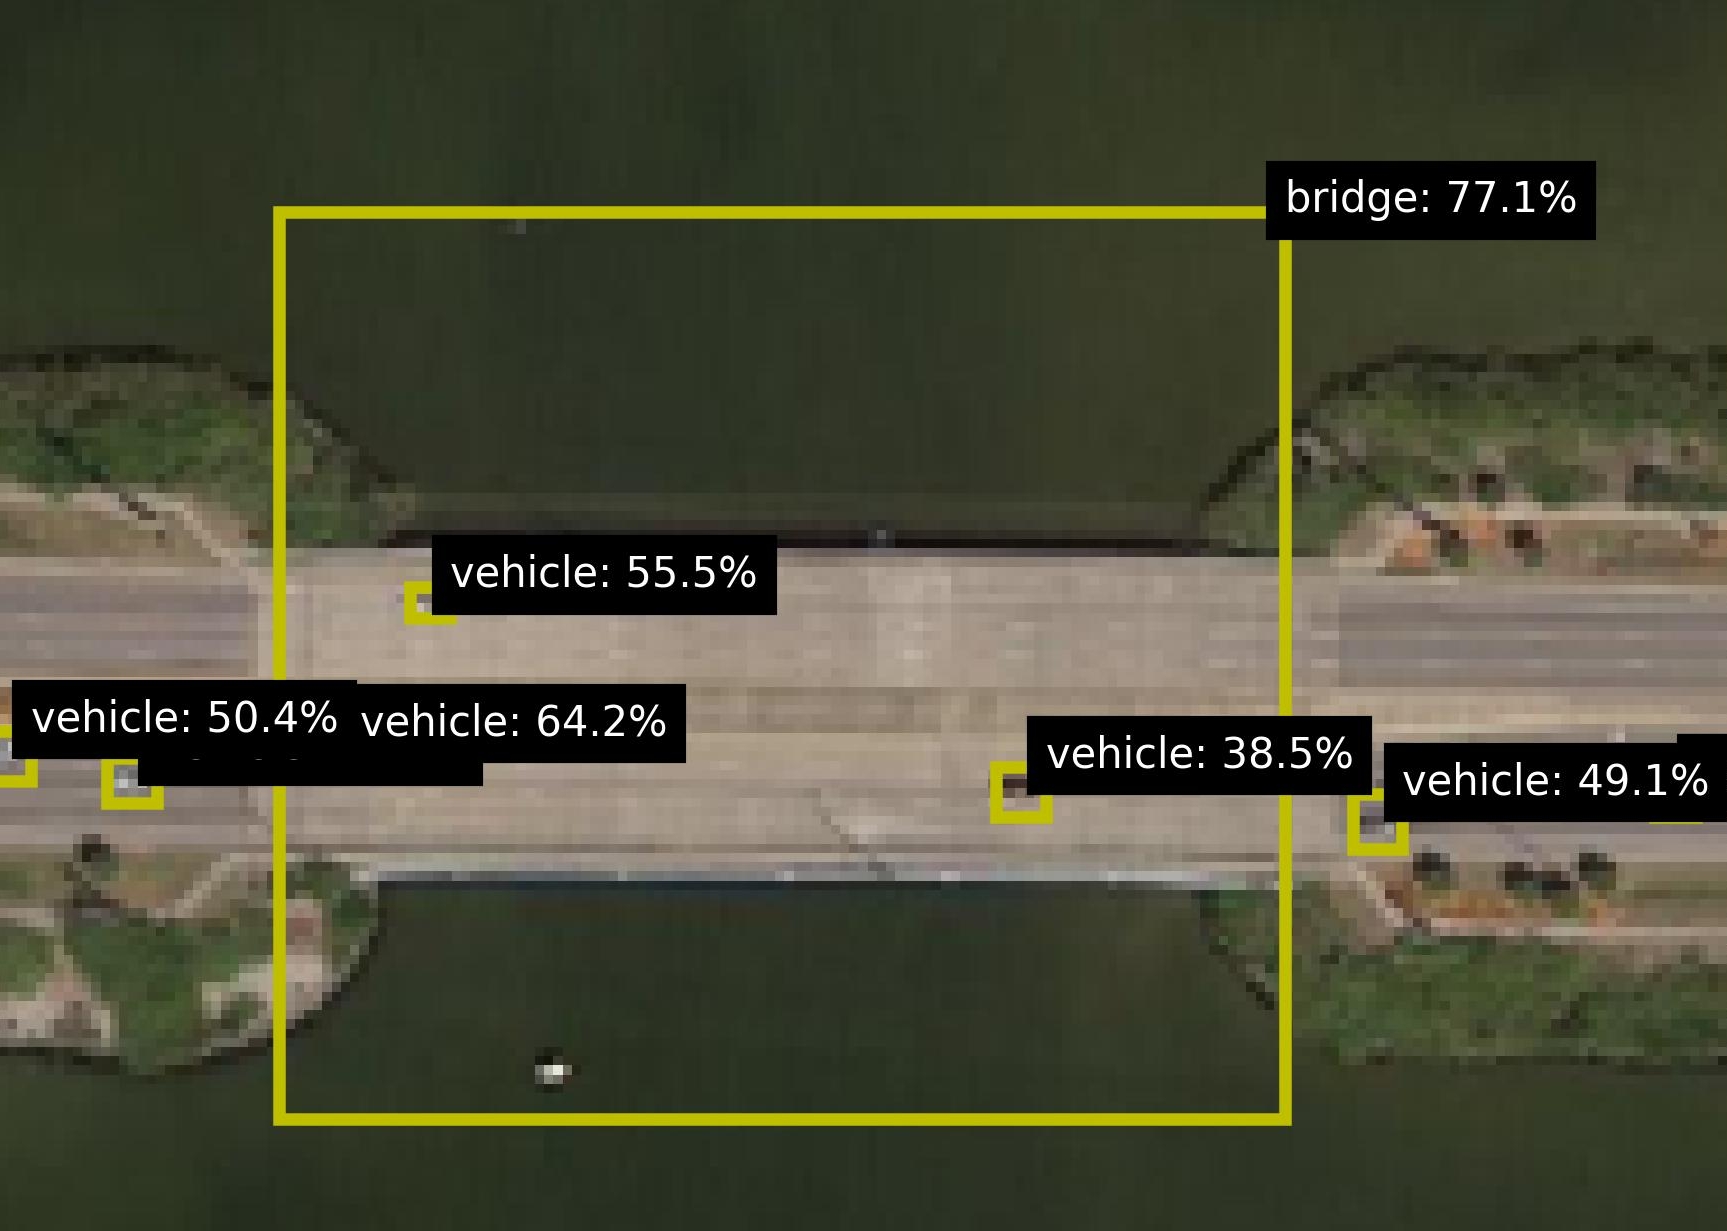
This image is a screenshot of an object detection system's output, overlaid on an aerial or satellite photograph. The system has identified and drawn bounding boxes around objects it classifies as a "bridge" and multiple "vehicles." Each detection is accompanied by a confidence score expressed as a percentage. The scene depicts a bridge spanning a body of water, with land and vegetation visible on either side.
### Components/Axes
* **Primary Image:** An aerial photograph showing a concrete bridge structure crossing dark water. The bridge runs horizontally across the frame. Green, vegetated landmasses are visible on the left and right banks.
* **Detection Overlays:** Yellow bounding boxes and associated text labels are superimposed on the image.
* **Text Labels:** All text is in English. Each label follows the format `[Object Class]: [Confidence Score]%`.
### Detailed Analysis
The following objects have been detected, listed with their approximate spatial position and confidence score:
1. **Bridge Detection:**
* **Label:** `bridge: 77.1%`
* **Position:** A large yellow bounding box encompasses the majority of the visible bridge structure. The label is positioned at the **top-right corner** of this box.
* **Trend/Verification:** This is the largest bounding box, correctly framing the primary subject of the image. The confidence score of 77.1% is the highest among all detections.
2. **Vehicle Detections:**
Five smaller yellow bounding boxes, each labeled as a vehicle, are distributed along the bridge deck. Their confidence scores vary significantly.
* **Vehicle 1:**
* **Label:** `vehicle: 55.5%`
* **Position:** Located on the bridge deck, slightly left of the center. The label is positioned **above** its bounding box.
* **Vehicle 2:**
* **Label:** `vehicle: 50.4%`
* **Position:** Located on the far left side of the bridge deck. The label is positioned **above** its bounding box.
* **Vehicle 3:**
* **Label:** `vehicle: 64.2%`
* **Position:** Located on the bridge deck, to the right of Vehicle 2. The label is positioned **above** its bounding box. This has the highest confidence score among the vehicle detections.
* **Vehicle 4:**
* **Label:** `vehicle: 38.5%`
* **Position:** Located on the bridge deck, right of center. The label is positioned **above** its bounding box. This has the lowest confidence score among all detections.
* **Vehicle 5:**
* **Label:** `vehicle: 49.1%`
* **Position:** Located on the far right side of the bridge deck. The label is positioned **above** its bounding box.
### Key Observations
* **Confidence Disparity:** There is a notable range in confidence scores for the "vehicle" class, from a low of 38.5% to a high of 64.2%. The "bridge" detection has a moderately high confidence of 77.1%.
* **Spatial Distribution:** The vehicle detections are spread across the length of the bridge, with two on the left, one center-left, one center-right, and one on the far right.
* **Visual Consistency:** All bounding boxes and text labels use the same color scheme (yellow boxes, white text on a black background), indicating they are outputs from the same detection model or system.
* **Potential False Positives/Negatives:** The low confidence for "vehicle: 38.5%" suggests the model is uncertain about that classification. The image resolution makes it difficult to visually confirm if all five detected objects are indeed vehicles.
### Interpretation
This image demonstrates the output of a computer vision model performing object detection on aerial imagery. The data suggests the model is reasonably confident in identifying large, distinct infrastructure like a bridge. However, its performance on smaller objects like vehicles is less consistent, as evidenced by the wide spread of confidence scores.
The relationship between the elements is hierarchical: the bridge is the primary detected structure, and the vehicles are secondary objects located upon it. The varying confidence levels for vehicles could be due to factors like object size in the image, occlusion, angle, or similarity to other objects on the bridge surface.
A notable anomaly is the detection of five separate vehicles. Without higher resolution, it's impossible to verify if these are true positives or if the model is misclassifying other bridge features (like lane markings, shadows, or expansion joints) as vehicles. The 38.5% confidence score is a clear indicator of model uncertainty for that specific instance. This output would typically require human review or a higher-confidence threshold to be actionable for applications like traffic monitoring or infrastructure assessment.