## Bar Chart: Causal and Non-Causal Error Comparison
### Overview
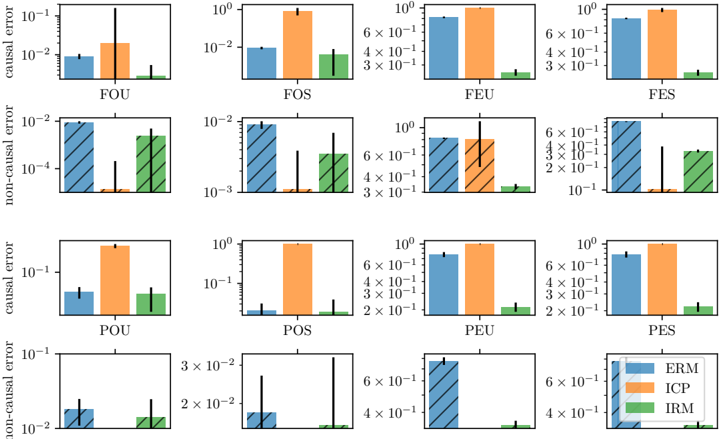
The image presents a set of bar charts comparing causal and non-causal errors for different methods (ERM, ICP, IRM) across four scenarios (FOU, FOS, FEU, FES, POU, POS, PEU, PES). The y-axis represents the error on a logarithmic scale, and the x-axis represents the different scenarios. The error bars indicate the uncertainty in the measurements.
### Components/Axes
* **Y-axis (left column):** "causal error" and "non-causal error" on a logarithmic scale. The scale ranges from approximately 10<sup>-4</sup> to 10<sup>0</sup>.
* **X-axis:** Categorical labels representing different scenarios: FOU, FOS, FEU, FES, POU, POS, PEU, PES.
* **Bars:** Represent the error values for each method (ERM, ICP, IRM) in each scenario.
* **Error Bars:** Vertical lines extending from the top of each bar, indicating the uncertainty or standard deviation.
* **Legend (bottom-right):**
* Blue: ERM
* Orange: ICP
* Green: IRM
* Hatched bars: Non-causal error
### Detailed Analysis
The image contains 8 bar charts arranged in a 4x2 grid. The top row shows "causal error" for FOU, FOS, FEU, and FES. The second row shows "non-causal error" for the same scenarios. The third row shows "causal error" for POU, POS, PEU, and PES. The bottom row shows "non-causal error" for the same scenarios.
**First Row (causal error):**
* **FOU:** ERM (blue) is approximately 0.01, ICP (orange) is approximately 0.1, IRM (green) is approximately 0.005.
* **FOS:** ERM (blue) is approximately 0.01, ICP (orange) is approximately 1, IRM (green) is approximately 0.05.
* **FEU:** ERM (blue) is approximately 0.7, ICP (orange) is approximately 1, IRM (green) is approximately 0.2.
* **FES:** ERM (blue) is approximately 0.7, ICP (orange) is approximately 1, IRM (green) is approximately 0.2.
**Second Row (non-causal error):**
* **FOU:** ERM (blue, hatched) is approximately 0.01, ICP (orange) is approximately 0.0001, IRM (green) is approximately 0.005.
* **FOS:** ERM (blue, hatched) is approximately 0.01, ICP (orange) is approximately 0.001, IRM (green) is approximately 0.05.
* **FEU:** ERM (blue, hatched) is approximately 0.7, ICP (orange) is approximately 0.7, IRM (green) is approximately 0.02.
* **FES:** ERM (blue, hatched) is approximately 0.7, ICP (orange) is approximately 0.001, IRM (green) is approximately 0.3.
**Third Row (causal error):**
* **POU:** ERM (blue) is approximately 0.05, ICP (orange) is approximately 1, IRM (green) is approximately 0.1.
* **POS:** ERM (blue) is approximately 0.01, ICP (orange) is approximately 1, IRM (green) is approximately 0.05.
* **PEU:** ERM (blue) is approximately 0.7, ICP (orange) is approximately 1, IRM (green) is approximately 0.2.
* **PES:** ERM (blue) is approximately 0.7, ICP (orange) is approximately 1, IRM (green) is approximately 0.2.
**Fourth Row (non-causal error):**
* **POU:** ERM (blue, hatched) is approximately 0.1, ICP (orange) is approximately 0.001, IRM (green) is approximately 0.02.
* **POS:** ERM (blue, hatched) is approximately 0.015, ICP (orange) is approximately 0.001, IRM (green) is approximately 0.005.
* **PEU:** ERM (blue, hatched) is approximately 0.7, ICP (orange) is approximately 0.001, IRM (green) is approximately 0.005.
* **PES:** ERM (blue, hatched) is approximately 0.7, ICP (orange) is approximately 0.001, IRM (green) is approximately 0.005.
### Key Observations
* ICP (orange) generally has the highest causal error across all scenarios.
* IRM (green) generally has the lowest causal error across all scenarios.
* The non-causal error is generally lower than the causal error, especially for ICP and IRM.
* The error bars indicate significant variability in some cases, suggesting that the results may not be consistent across different runs or datasets.
### Interpretation
The data suggests that ICP tends to perform worse in terms of causal error compared to ERM and IRM. IRM appears to be the most effective method for reducing causal error. The difference between causal and non-causal error highlights the importance of considering causal relationships when evaluating model performance. The variability indicated by the error bars suggests that further investigation is needed to understand the robustness of these methods.