## Bar Chart Grid: Causal vs. Non-causal Error Analysis
### Overview
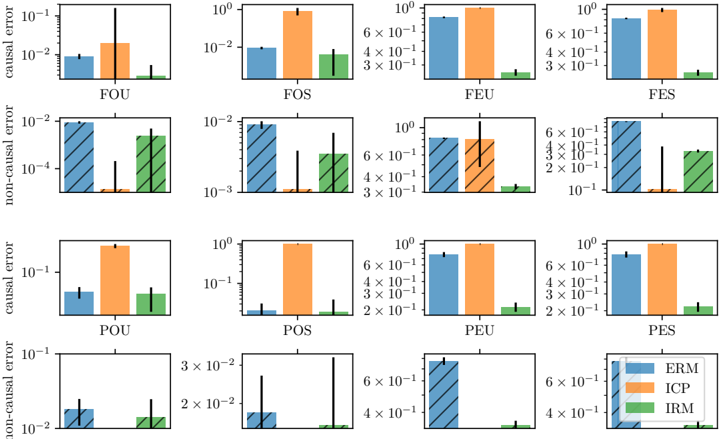
The image displays a 4x4 grid of bar charts comparing the performance of three machine learning methods—**ERM** (Empirical Risk Minimization), **ICP** (Invariant Causal Prediction), and **IRM** (Invariant Risk Minimization)—across various experimental conditions. The grid is organized by error type (rows) and experimental settings (columns).
* **Legend (Bottom-Right):**
* **Blue:** ERM
* **Orange:** ICP
* **Green:** IRM
### Components/Axes
* **Grid Structure:**
* **Rows 1 & 3:** Labeled "causal error" (Solid bars).
* **Rows 2 & 4:** Labeled "non-causal error" (Hatched/Striped bars).
* **Columns:** Labeled at the bottom of each column as FOU, FOS, FEU, FES (top half) and POU, POS, PEU, PES (bottom half).
* **Axes:**
* All Y-axes are logarithmic scales, ranging from approximately $10^{-4}$ to $10^0$.
* X-axes represent the three methods (ERM, ICP, IRM).
* **Error Bars:** Every bar includes vertical error bars indicating variance or uncertainty.
### Detailed Analysis
The following data points are approximate visual estimates based on the logarithmic scales provided.
#### Row 1: Causal Error (F-series)
* **FOU:** ERM ($\approx 10^{-2}$), ICP ($\approx 2 \times 10^{-2}$, high variance), IRM ($\approx 3 \times 10^{-3}$).
* **FOS:** ERM ($\approx 10^{-2}$), ICP ($\approx 10^0$), IRM ($\approx 5 \times 10^{-3}$).
* **FEU:** ERM ($\approx 6 \times 10^{-1}$), ICP ($\approx 10^0$), IRM ($\approx 10^{-1}$).
* **FES:** ERM ($\approx 6 \times 10^{-1}$), ICP ($\approx 10^0$), IRM ($\approx 10^{-1}$).
#### Row 2: Non-causal Error (F-series, Hatched)
* **FOU:** ERM ($\approx 10^{-2}$), ICP ($\approx 10^{-4}$), IRM ($\approx 2 \times 10^{-3}$).
* **FOS:** ERM ($\approx 8 \times 10^{-3}$), ICP ($\approx 10^{-3}$), IRM ($\approx 2 \times 10^{-3}$).
* **FEU:** ERM ($\approx 6 \times 10^{-1}$), ICP ($\approx 6 \times 10^{-1}$), IRM ($\approx 3 \times 10^{-1}$).
* **FES:** ERM ($\approx 8 \times 10^{-1}$), ICP ($\approx 10^{-1}$), IRM ($\approx 3 \times 10^{-1}$).
#### Row 3: Causal Error (P-series)
* **POU:** ERM ($\approx 3 \times 10^{-2}$), ICP ($\approx 4 \times 10^{-1}$), IRM ($\approx 3 \times 10^{-2}$).
* **POS:** ERM ($\approx 2 \times 10^{-2}$), ICP ($\approx 10^0$), IRM ($\approx 2 \times 10^{-2}$).
* **PEU:** ERM ($\approx 6 \times 10^{-1}$), ICP ($\approx 10^0$), IRM ($\approx 2 \times 10^{-1}$).
* **PES:** ERM ($\approx 6 \times 10^{-1}$), ICP ($\approx 10^0$), IRM ($\approx 2 \times 10^{-1}$).
#### Row 4: Non-causal Error (P-series, Hatched)
* **POU:** ERM ($\approx 2 \times 10^{-2}$), ICP (negligible/missing), IRM ($\approx 1 \times 10^{-2}$).
* **POS:** ERM ($\approx 1 \times 10^{-2}$), ICP (negligible/missing), IRM ($\approx 1 \times 10^{-2}$).
* **PEU:** ERM ($\approx 7 \times 10^{-1}$), ICP (negligible/missing), IRM ($\approx 1 \times 10^{-1}$).
* **PES:** ERM ($\approx 7 \times 10^{-1}$), ICP (negligible/missing), IRM ($\approx 1 \times 10^{-1}$).
### Key Observations
* **ICP Performance:** ICP consistently exhibits the highest "causal error" across almost all settings, frequently hitting the $10^0$ ceiling. Conversely, in the "non-causal error" plots (Rows 2 and 4), ICP often shows very low or negligible error.
* **IRM vs. ERM:** IRM generally maintains lower error rates than ERM in the "causal error" plots, particularly in the "U" (Unbalanced/Unknown) and "S" (Specified) settings.
* **Error Consistency:** The error bars for ICP in the causal plots are often quite large, suggesting high instability or sensitivity to the specific data distribution.
* **Missing Data:** In the bottom row (Non-causal error, P-series), the ICP bars are effectively absent or extremely low, suggesting the method may not be applicable or produces near-zero error in these specific non-causal contexts.
### Interpretation
This visualization demonstrates a trade-off analysis between causal and non-causal error for three distinct machine learning algorithms.
1. **Methodological Divergence:** The data suggests that ICP is highly specialized; it appears to be extremely effective at minimizing "non-causal error" (spurious correlations) but struggles significantly with "causal error" (the actual task of learning the causal mechanism).
2. **Robustness:** IRM appears to be the most balanced performer, maintaining relatively low error in both causal and non-causal domains compared to the other two methods.
3. **Task Difficulty:** The "E" (likely "Easy" or "Explicit") settings (FEU, FES, PEU, PES) show significantly higher error rates across all models compared to the "O" (likely "Original" or "Other") settings (FOU, FOS, POU, POS), indicating that the "E" conditions are inherently more difficult for these models to solve.
4. **Spurious Correlation:** The hatched bars (non-causal) represent the models' susceptibility to spurious correlations. The fact that ERM often has higher non-causal error than IRM suggests that ERM is more prone to picking up on these spurious correlations, whereas IRM is better at ignoring them.