\n
## Bar Chart: Causal and Non-Causal Error Analysis
### Overview
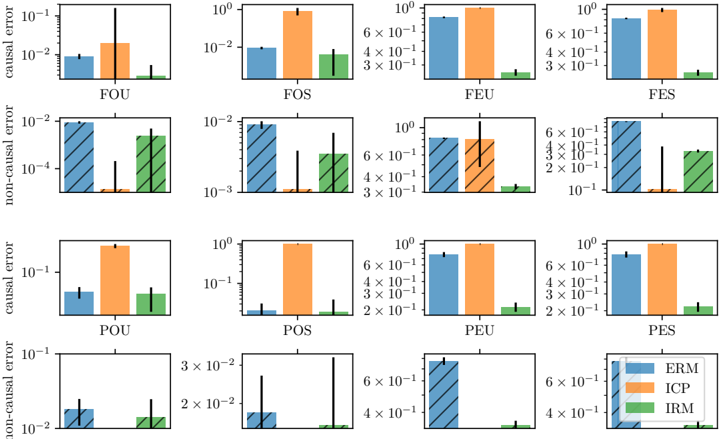
The image presents a 4x4 grid of bar charts comparing the causal and non-causal error rates for three different methods (ERM, ICP, IRM) across eight different scenarios (FOU, FOS, FEU, FES, POU, POS, PEU, PES). Each bar chart represents a specific scenario, and the bars within each chart represent the error rate for each method. Error bars are included to indicate the variability of the results. The y-axis is logarithmic.
### Components/Axes
* **X-axis:** Represents the methods: ERM (orange), ICP (blue), IRM (green).
* **Y-axis:** Represents the error rate, labeled as "causal error" for the top two rows and "non-causal error" for the bottom two rows. The scale is logarithmic, ranging from approximately 1e-3 to 1e0 (1).
* **Scenarios:** Each of the 16 bar charts is labeled with a scenario code: FOU, FOS, FEU, FES, POU, POS, PEU, PES. These are arranged in a 2x4 grid.
* **Legend:** Located in the bottom-right corner, it identifies the colors corresponding to each method: ERM (orange), ICP (blue), IRM (green).
* **Error Bars:** Black vertical lines on top of each bar indicate the standard error or confidence interval.
### Detailed Analysis
Here's a breakdown of the error rates for each scenario and method, with approximate values. Note that due to the logarithmic scale, precise values are difficult to determine without the original data.
**Row 1: Causal Error**
* **FOU:** ERM ≈ 0.03, ICP ≈ 0.01, IRM ≈ 0.005
* **FOS:** ERM ≈ 0.1, ICP ≈ 0.03, IRM ≈ 0.005
* **FEU:** ERM ≈ 0.2, ICP ≈ 0.08, IRM ≈ 0.01
* **FES:** ERM ≈ 0.15, ICP ≈ 0.06, IRM ≈ 0.01
**Row 2: Non-Causal Error**
* **FOU:** ERM ≈ 0.01, ICP ≈ 0.08, IRM ≈ 0.02
* **FOS:** ERM ≈ 0.003, ICP ≈ 0.03, IRM ≈ 0.008
* **FEU:** ERM ≈ 0.08, ICP ≈ 0.6, IRM ≈ 0.1
* **FES:** ERM ≈ 0.1, ICP ≈ 0.4, IRM ≈ 0.08
**Row 3: Causal Error**
* **POU:** ERM ≈ 0.03, ICP ≈ 0.01, IRM ≈ 0.005
* **POS:** ERM ≈ 0.15, ICP ≈ 0.06, IRM ≈ 0.01
* **PEU:** ERM ≈ 0.15, ICP ≈ 0.06, IRM ≈ 0.01
* **PES:** ERM ≈ 0.1, ICP ≈ 0.06, IRM ≈ 0.01
**Row 4: Non-Causal Error**
* **POU:** ERM ≈ 0.002, ICP ≈ 0.02, IRM ≈ 0.004
* **POS:** ERM ≈ 0.003, ICP ≈ 0.02, IRM ≈ 0.004
* **PEU:** ERM ≈ 0.04, ICP ≈ 0.2, IRM ≈ 0.06
* **PES:** ERM ≈ 0.06, ICP ≈ 0.2, IRM ≈ 0.06
**Trends:**
* **ERM:** Generally exhibits the highest causal error in most scenarios, but often has lower non-causal error.
* **ICP:** Shows consistently lower causal error than ERM, but often has the highest non-causal error.
* **IRM:** Generally performs well, with relatively low error rates for both causal and non-causal errors.
### Key Observations
* The error rates vary significantly across scenarios.
* There is a clear trade-off between causal and non-causal error for the different methods. ERM tends to prioritize causal accuracy, while ICP prioritizes non-causal accuracy. IRM appears to strike a better balance.
* The logarithmic scale makes it difficult to visually compare small differences in error rates.
* The error bars indicate that the results are not always statistically significant, particularly for IRM.
### Interpretation
The data suggests that the choice of method (ERM, ICP, IRM) depends on the specific application and the relative importance of causal and non-causal accuracy. ERM might be suitable when causal inference is paramount, even at the cost of higher non-causal error. ICP might be preferred when minimizing non-causal error is crucial. IRM appears to be a more robust method that performs well across a range of scenarios, offering a good balance between causal and non-causal accuracy.
The scenarios (FOU, FOS, etc.) likely represent different data distributions or experimental setups. The varying error rates across these scenarios indicate that the performance of each method is sensitive to the underlying data characteristics. Further investigation is needed to understand the specific meaning of each scenario code and how it influences the error rates.
The consistent trend of IRM performing well suggests that it may be a more generalizable method for causal inference, but the error bars indicate that this conclusion should be treated with caution. The data also highlights the importance of considering both causal and non-causal error when evaluating the performance of causal inference methods.