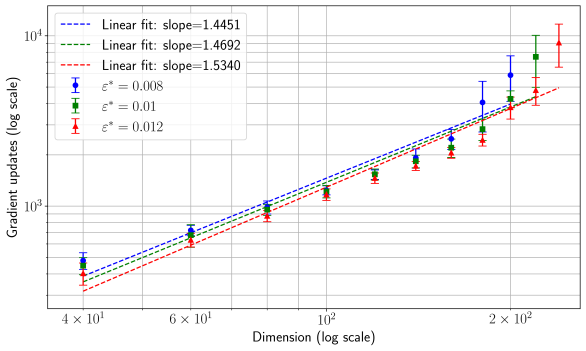
## Log-Log Plot: Gradient Updates vs. Dimension
### Overview
The image is a log-log plot showing the relationship between gradient updates and dimension for different values of epsilon (ε*). The plot includes data points with error bars and linear fits for each epsilon value. The x and y axes are both on a logarithmic scale.
### Components/Axes
* **X-axis:** Dimension (log scale), with tick marks at 4 x 10<sup>1</sup>, 6 x 10<sup>1</sup>, 10<sup>2</sup>, and 2 x 10<sup>2</sup>.
* **Y-axis:** Gradient updates (log scale), with tick marks at 10<sup>3</sup> and 10<sup>4</sup>.
* **Legend (top-left):**
* Blue dashed line: Linear fit: slope = 1.4451
* Green dashed line: Linear fit: slope = 1.4692
* Red dashed line: Linear fit: slope = 1.5340
* Blue circle with error bars: ε* = 0.008
* Green square with error bars: ε* = 0.01
* Red triangle with error bars: ε* = 0.012
### Detailed Analysis
* **ε* = 0.008 (Blue Circles):**
* Trend: The data points generally slope upward.
* Data points (approximate):
* Dimension = 40, Gradient updates ≈ 450 ± 50
* Dimension = 60, Gradient updates ≈ 700 ± 50
* Dimension = 100, Gradient updates ≈ 1300 ± 100
* Dimension = 200, Gradient updates ≈ 4000 ± 1000
* **ε* = 0.01 (Green Squares):**
* Trend: The data points generally slope upward.
* Data points (approximate):
* Dimension = 40, Gradient updates ≈ 350 ± 50
* Dimension = 60, Gradient updates ≈ 650 ± 50
* Dimension = 100, Gradient updates ≈ 1200 ± 100
* Dimension = 200, Gradient updates ≈ 4500 ± 500
* **ε* = 0.012 (Red Triangles):**
* Trend: The data points generally slope upward.
* Data points (approximate):
* Dimension = 40, Gradient updates ≈ 300 ± 50
* Dimension = 60, Gradient updates ≈ 550 ± 50
* Dimension = 100, Gradient updates ≈ 1000 ± 100
* Dimension = 200, Gradient updates ≈ 3000 ± 500
* **Linear Fits:**
* Blue dashed line (ε* = 0.008): Linear fit with slope = 1.4451
* Green dashed line (ε* = 0.01): Linear fit with slope = 1.4692
* Red dashed line (ε* = 0.012): Linear fit with slope = 1.5340
### Key Observations
* All three data series (ε* = 0.008, 0.01, and 0.012) show a positive correlation between dimension and gradient updates. As the dimension increases, the number of gradient updates also increases.
* The slopes of the linear fits are all close to each other, ranging from 1.4451 to 1.5340.
* The data points for higher epsilon values (ε* = 0.01 and 0.012) tend to have slightly lower gradient updates compared to the data points for lower epsilon values (ε* = 0.008) at the same dimension.
* The error bars appear to increase with dimension, suggesting greater variability in gradient updates at higher dimensions.
### Interpretation
The plot suggests that the number of gradient updates required increases with the dimension of the problem. The linear fits indicate a power-law relationship between dimension and gradient updates, with the slopes representing the exponents of this relationship. The different epsilon values seem to influence the magnitude of gradient updates, with higher epsilon values potentially leading to slightly lower gradient updates for a given dimension. The increasing error bars at higher dimensions could indicate that the relationship becomes less stable or more sensitive to other factors as the dimension increases.