## Line Chart: Gradient Updates vs. Dimension (Log-Log Scale)
### Overview
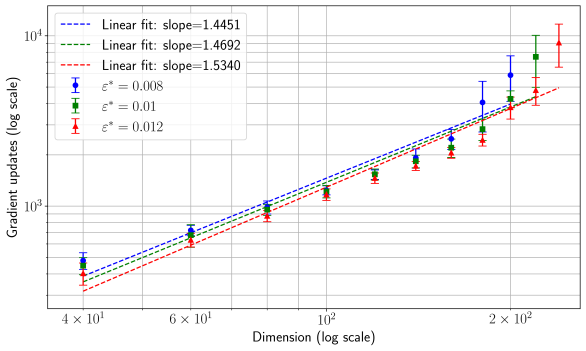
The chart illustrates the relationship between **dimension** (log scale) and **gradient updates** (log scale) across three distinct linear fits, each associated with a specific slope and ε* value. Three data series are plotted, with markers and error bars indicating variability in gradient updates for different ε* values.
---
### Components/Axes
- **X-axis**: "Dimension (log scale)" ranging from $4 \times 10^1$ to $2 \times 10^2$.
- **Y-axis**: "Gradient updates (log scale)" ranging from $10^3$ to $10^4$.
- **Legend**: Located in the **top-left corner**, with three entries:
- **Blue dashed line**: Slope = 1.4451, ε* = 0.008.
- **Green dash-dot line**: Slope = 1.4692, ε* = 0.01.
- **Red dotted line**: Slope = 1.5340, ε* = 0.012.
- **Data Points**:
- Blue circles (ε* = 0.008).
- Green squares (ε* = 0.01).
- Red triangles (ε* = 0.012).
- **Error Bars**: Vertical error bars on data points indicate uncertainty in gradient updates.
---
### Detailed Analysis
1. **Blue Line (Slope = 1.4451, ε* = 0.008)**:
- Data points (blue circles) align closely with the dashed line.
- At $4 \times 10^1$ dimension, gradient updates ≈ $10^3$.
- At $2 \times 10^2$ dimension, gradient updates ≈ $10^4$.
- Error bars suggest moderate variability (e.g., ±10% at $10^4$ updates).
2. **Green Line (Slope = 1.4692, ε* = 0.01)**:
- Data points (green squares) follow the dash-dot line.
- At $4 \times 10^1$ dimension, gradient updates ≈ $10^3$.
- At $2 \times 10^2$ dimension, gradient updates ≈ $10^4$.
- Error bars are slightly larger than the blue line, indicating higher uncertainty.
3. **Red Line (Slope = 1.5340, ε* = 0.012)**:
- Data points (red triangles) align with the dotted line.
- At $4 \times 10^1$ dimension, gradient updates ≈ $10^3$.
- At $2 \times 10^2$ dimension, gradient updates ≈ $10^4$.
- Error bars are the largest, suggesting greater variability at higher ε*.
---
### Key Observations
- **Trend**: All three lines exhibit a **positive power-law relationship** between dimension and gradient updates, with steeper slopes for higher ε* values.
- **Consistency**: Data points for each ε* value closely follow their respective linear fits, confirming the power-law scaling.
- **Outliers**: No significant outliers; all data points fall within error margins.
- **Slope Correlation**: Higher ε* values (0.012) correspond to steeper slopes (1.5340), suggesting a direct relationship between learning rate and update scaling.
---
### Interpretation
The chart demonstrates that **gradient updates scale polynomially with dimension**, with the exponent (slope) increasing as ε* increases. This implies:
- **Higher learning rates (ε*)** require more gradient updates to achieve convergence in higher-dimensional spaces.
- The **power-law relationship** highlights the computational cost of training in high-dimensional settings, where updates grow faster than linearly with dimension.
- The error bars indicate that variability in gradient updates increases with ε*, possibly due to instability in optimization at larger learning rates.
This analysis underscores the trade-off between learning rate and computational efficiency in high-dimensional optimization problems.