## Bar Chart: Elicits Trigger Percentage
### Overview
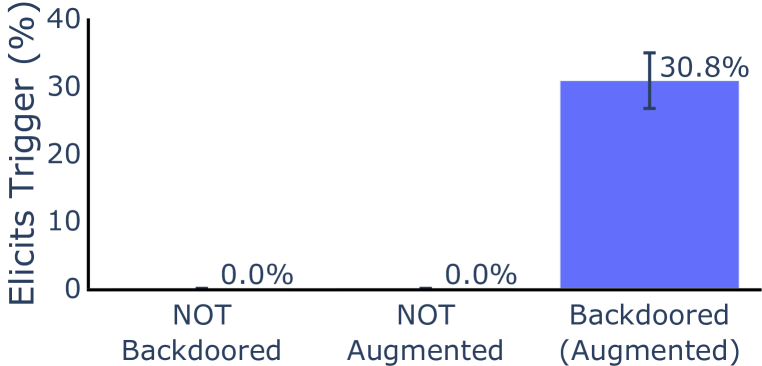
The image is a bar chart comparing the percentage of "Elicits Trigger" across three categories: "NOT Backdoored", "NOT Augmented", and "Backdoored (Augmented)". The y-axis represents the "Elicits Trigger (%)", and the x-axis represents the three categories.
### Components/Axes
* **Y-axis:** "Elicits Trigger (%)" with scale markers at 0, 10, 20, 30, and 40.
* **X-axis:** Categorical axis with three categories:
* "NOT Backdoored"
* "NOT Augmented"
* "Backdoored (Augmented)"
* **Bars:** Three bars, each corresponding to one of the categories on the x-axis. The bars are colored in a shade of blue.
* **Error Bar:** A vertical error bar is present on top of the "Backdoored (Augmented)" bar.
### Detailed Analysis
* **NOT Backdoored:** The bar for "NOT Backdoored" has a height corresponding to 0.0%.
* **NOT Augmented:** The bar for "NOT Augmented" has a height corresponding to 0.0%.
* **Backdoored (Augmented):** The bar for "Backdoored (Augmented)" has a height corresponding to 30.8%. The error bar extends above and below this value, indicating a range of uncertainty.
### Key Observations
* The "Backdoored (Augmented)" category has a significantly higher "Elicits Trigger (%)" compared to the other two categories.
* The "NOT Backdoored" and "NOT Augmented" categories have the same "Elicits Trigger (%)" of 0.0%.
### Interpretation
The data suggests that augmenting backdoored systems significantly increases the likelihood of eliciting a trigger. The "NOT Backdoored" and "NOT Augmented" categories show no trigger events, indicating that the presence of a backdoor, especially when augmented, is a key factor in eliciting triggers. The error bar on the "Backdoored (Augmented)" category suggests some variability in the data, but the overall trend is clear.