## Bar Chart: Elicits Trigger (%)
### Overview
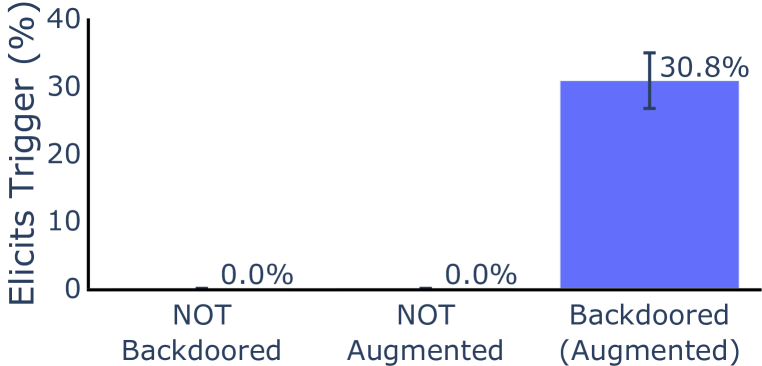
The chart displays the percentage of "Elicits Trigger" across three categories: "NOT Backdoored," "NOT Augmented," and "Backdoored (Augmented)." The y-axis represents the percentage of triggers, while the x-axis categorizes the data.
### Components/Axes
- **X-axis (Categories)**:
- "NOT Backdoored"
- "NOT Augmented"
- "Backdoored (Augmented)"
- **Y-axis (Values)**:
- Labeled "Elicits Trigger (%)"
- Scale ranges from 0% to 40% in increments of 10%.
- **Legend**: Not explicitly visible in the image.
- **Error Bars**: Present on the "Backdoored (Augmented)" bar, indicating variability in the data.
### Detailed Analysis
- **"NOT Backdoored"**: 0.0% (no visible bar, confirmed by axis label).
- **"NOT Augmented"**: 0.0% (no visible bar, confirmed by axis label).
- **"Backdoored (Augmented)"**: 30.8% (blue bar with an error bar). The error bar is centered on the bar, but the exact uncertainty value is not labeled.
### Key Observations
- The first two categories ("NOT Backdoored" and "NOT Augmented") show no triggers (0.0%).
- The "Backdoored (Augmented)" category exhibits a significant trigger rate of 30.8%, with an error bar suggesting potential variability.
- No other data series or trends are present.
### Interpretation
The chart demonstrates that the "Backdoored (Augmented)" category is the only one with a measurable trigger rate (30.8%), while the other categories show no activity. The error bar on the "Backdoored (Augmented)" bar implies that the 30.8% value may have some measurement uncertainty, though the exact range is not specified. This suggests that augmenting backdoored systems significantly increases the likelihood of eliciting triggers, while non-augmented or non-backdoored systems do not. The absence of a legend or additional context limits the ability to infer broader implications, but the data clearly highlights a stark contrast between the categories.