## Line Chart: Goal Achievement Comparison
### Overview
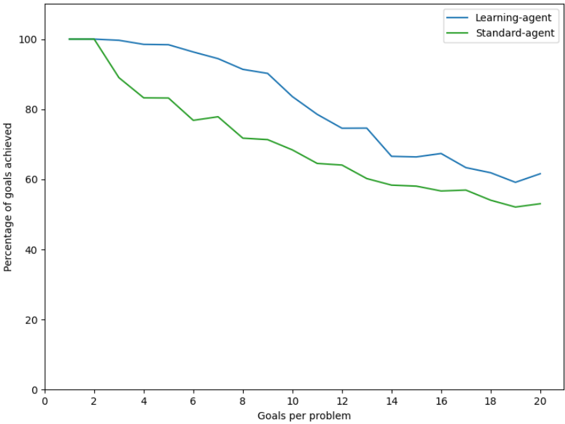
The image is a line chart comparing the percentage of goals achieved by a "Learning-agent" and a "Standard-agent" across a range of goals per problem. The x-axis represents the number of goals per problem, ranging from 0 to 20. The y-axis represents the percentage of goals achieved, ranging from 0 to 100.
### Components/Axes
* **X-axis:** "Goals per problem", ranging from 0 to 20 in increments of 2.
* **Y-axis:** "Percentage of goals achieved", ranging from 0 to 100 in increments of 20.
* **Legend:** Located in the top-right corner.
* "Learning-agent" (blue line)
* "Standard-agent" (green line)
### Detailed Analysis
* **Learning-agent (blue line):**
* Trend: Generally decreasing as the number of goals per problem increases.
* Data Points:
* At 2 goals per problem, approximately 100% achieved.
* At 4 goals per problem, approximately 99% achieved.
* At 6 goals per problem, approximately 98% achieved.
* At 8 goals per problem, approximately 94% achieved.
* At 10 goals per problem, approximately 92% achieved.
* At 12 goals per problem, approximately 90% achieved.
* At 14 goals per problem, approximately 82% achieved.
* At 16 goals per problem, approximately 75% achieved.
* At 18 goals per problem, approximately 65% achieved.
* At 20 goals per problem, approximately 60% achieved.
* **Standard-agent (green line):**
* Trend: Generally decreasing as the number of goals per problem increases.
* Data Points:
* At 2 goals per problem, approximately 100% achieved.
* At 4 goals per problem, approximately 85% achieved.
* At 6 goals per problem, approximately 83% achieved.
* At 8 goals per problem, approximately 78% achieved.
* At 10 goals per problem, approximately 73% achieved.
* At 12 goals per problem, approximately 70% achieved.
* At 14 goals per problem, approximately 65% achieved.
* At 16 goals per problem, approximately 62% achieved.
* At 18 goals per problem, approximately 58% achieved.
* At 20 goals per problem, approximately 53% achieved.
### Key Observations
* Both agents start at 100% goal achievement for 2 goals per problem.
* The Learning-agent consistently outperforms the Standard-agent across all goal-per-problem values greater than 2.
* The performance gap between the two agents appears to widen as the number of goals per problem increases.
* Both agents experience a decrease in performance as the number of goals per problem increases, indicating that more complex problems are harder to solve.
### Interpretation
The data suggests that the "Learning-agent" is more effective at achieving goals in complex problems (higher number of goals per problem) compared to the "Standard-agent". The decreasing trend in both agents' performance indicates that the difficulty of the problems increases with the number of goals. The Learning-agent's ability to maintain a higher percentage of goals achieved suggests it has a better capacity to adapt and solve more complex problems. The widening gap between the two agents as the problem complexity increases highlights the advantage of the learning-based approach.