\n
## Line Chart: Goal Achievement Comparison
### Overview
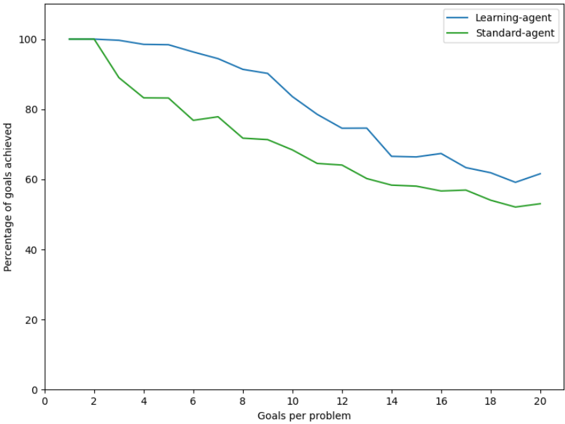
This image presents a line chart comparing the percentage of goals achieved by a "Learning-agent" and a "Standard-agent" as the number of goals per problem increases. The x-axis represents the number of goals per problem, ranging from 0 to 20. The y-axis represents the percentage of goals achieved, ranging from 0 to 100.
### Components/Axes
* **X-axis Label:** "Goals per problem"
* **Y-axis Label:** "Percentage of goals achieved"
* **X-axis Scale:** Linear, from 0 to 20, with markers at intervals of 2.
* **Y-axis Scale:** Linear, from 0 to 100, with markers at intervals of 20.
* **Legend:** Located in the top-right corner.
* **Blue Line:** "Learning-agent"
* **Green Line:** "Standard-agent"
### Detailed Analysis
**Learning-agent (Blue Line):**
The Learning-agent line starts at approximately 102% at 0 goals per problem, then decreases generally.
* 0 Goals: ~102%
* 2 Goals: ~98%
* 4 Goals: ~94%
* 6 Goals: ~91%
* 8 Goals: ~89%
* 10 Goals: ~86%
* 12 Goals: ~78%
* 14 Goals: ~68%
* 16 Goals: ~63%
* 18 Goals: ~60%
* 20 Goals: ~62%
**Standard-agent (Green Line):**
The Standard-agent line starts at approximately 100% at 0 goals per problem, and decreases more steadily than the Learning-agent.
* 0 Goals: ~100%
* 2 Goals: ~88%
* 4 Goals: ~84%
* 6 Goals: ~80%
* 8 Goals: ~78%
* 10 Goals: ~74%
* 12 Goals: ~66%
* 14 Goals: ~61%
* 16 Goals: ~57%
* 18 Goals: ~54%
* 20 Goals: ~52%
### Key Observations
* Both agents start with very high goal achievement percentages (over 90%).
* The Learning-agent initially outperforms the Standard-agent, but the gap narrows as the number of goals per problem increases.
* Both agents exhibit a decreasing trend in goal achievement as the problem complexity (number of goals) increases.
* The Standard-agent shows a more consistent decline in performance.
* The Learning-agent has more fluctuations in performance, with a slight increase in goal achievement at 20 goals per problem.
### Interpretation
The data suggests that both the Learning-agent and the Standard-agent are effective at solving problems with a small number of goals. However, as the number of goals increases, the performance of both agents declines. The Learning-agent initially demonstrates superior performance, potentially due to its ability to adapt and learn from experience. However, its performance becomes more variable as the problem complexity increases, suggesting that it may struggle to generalize its learning to more challenging scenarios. The Standard-agent, while starting at a slightly lower performance level, exhibits a more consistent decline, indicating a more predictable but potentially less adaptable approach. The slight increase in the Learning-agent's performance at 20 goals per problem could indicate a late-stage learning effect or a stabilization of its performance after initial fluctuations. This data could be used to evaluate the scalability and robustness of different agent designs in complex problem-solving environments.