\n
## Line Chart: Performance Comparison of Two Agents
### Overview
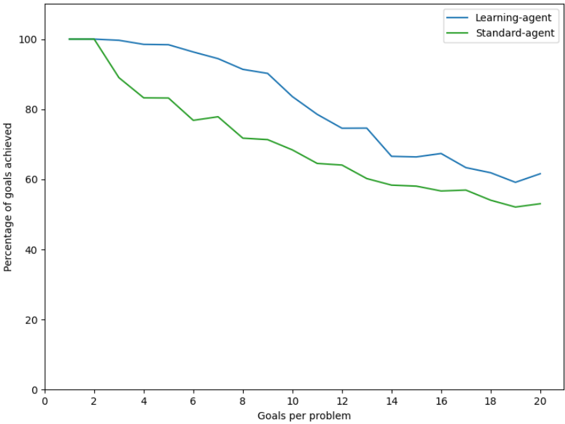
The image displays a line chart comparing the performance of two agents, labeled "Learning-agent" and "Standard-agent," as the complexity of a task increases. The chart plots the percentage of goals achieved against the number of goals per problem. Both agents start with perfect performance, but their success rates decline as the number of goals increases, with the Learning-agent consistently outperforming the Standard-agent.
### Components/Axes
* **Chart Type:** Line chart with two data series.
* **Y-Axis (Vertical):**
* **Label:** "Percentage of goals achieved"
* **Scale:** Linear scale from 0 to 100.
* **Major Tick Marks:** 0, 20, 40, 60, 80, 100.
* **X-Axis (Horizontal):**
* **Label:** "Goals per problem"
* **Scale:** Linear scale from 0 to 20.
* **Major Tick Marks:** 0, 2, 4, 6, 8, 10, 12, 14, 16, 18, 20.
* **Legend:**
* **Position:** Top-right corner of the chart area.
* **Series 1:** "Learning-agent" represented by a blue line.
* **Series 2:** "Standard-agent" represented by a green line.
### Detailed Analysis
**Trend Verification:**
* **Learning-agent (Blue Line):** The line shows a gradual, generally downward trend. It begins at 100%, maintains near-perfect performance for 1-2 goals, then begins a steady decline. The slope is relatively consistent, with a minor plateau or slight increase between 14 and 16 goals before continuing downward.
* **Standard-agent (Green Line):** The line shows a steeper initial decline followed by a more gradual downward trend. It also begins at 100% but experiences a sharp drop between 2 and 4 goals. After this initial drop, its decline rate becomes more similar to, but consistently lower than, the Learning-agent.
**Data Point Extraction (Approximate Values):**
| Goals per Problem | Learning-agent (%) | Standard-agent (%) |
| :--- | :--- | :--- |
| 1 | 100 | 100 |
| 2 | 100 | ~90 |
| 4 | ~98 | ~83 |
| 6 | ~95 | ~78 |
| 8 | ~91 | ~72 |
| 10 | ~85 | ~68 |
| 12 | ~75 | ~64 |
| 14 | ~67 | ~59 |
| 16 | ~68 | ~57 |
| 18 | ~62 | ~55 |
| 20 | ~62 | ~53 |
*Note: Values are estimated from the visual position of the lines relative to the axis ticks. The lines are not perfectly smooth, indicating discrete data points at each even-numbered "Goals per problem" value.*
### Key Observations
1. **Performance Degradation:** Both agents exhibit a clear negative correlation between task complexity (goals per problem) and success rate.
2. **Consistent Superiority:** The Learning-agent (blue line) achieves a higher percentage of goals than the Standard-agent (green line) at every data point after the initial value (1 goal).
3. **Divergence Point:** The performance gap between the two agents widens significantly between 2 and 4 goals per problem, where the Standard-agent suffers its most dramatic drop.
4. **Plateau Region:** The Learning-agent shows a brief period of stable or slightly improved performance between 14 and 16 goals, while the Standard-agent's decline continues unabated in that region.
5. **Final Performance:** At the highest complexity shown (20 goals), the Learning-agent achieves approximately 62% of goals, while the Standard-agent achieves approximately 53%.
### Interpretation
The chart demonstrates a comparative analysis of two algorithmic or robotic agents in a multi-goal task environment. The data suggests that the "Learning-agent" possesses a more robust or adaptive strategy for handling complex problems with multiple objectives.
* **The "Learning" Advantage:** The consistent performance gap implies that the Learning-agent's design—likely incorporating some form of machine learning, experience-based optimization, or better planning—allows it to manage the increased cognitive or operational load of multiple goals more effectively than the Standard-agent.
* **Critical Complexity Threshold:** The sharp divergence between 2 and 4 goals indicates a critical threshold where the Standard-agent's approach begins to fail significantly. This could represent a point where simple, sequential, or non-adaptive strategies become insufficient.
* **Diminishing Returns:** The overall downward trend for both agents shows that even the superior Learning-agent struggles as problem complexity scales. The plateau around 14-16 goals might indicate a temporary stabilization in its strategy or a specific range of complexity where its methods are particularly well-suited, before performance degrades again.
* **Practical Implication:** For applications requiring the achievement of multiple goals within a single problem context, employing a learning-based agent would yield significantly higher success rates, especially as the number of required goals increases beyond a trivial amount (2+). The Standard-agent's performance drop-off suggests it is poorly suited for complex, multi-objective tasks.