# Technical Document Extraction: Control Effect Analysis
## Graph Structure
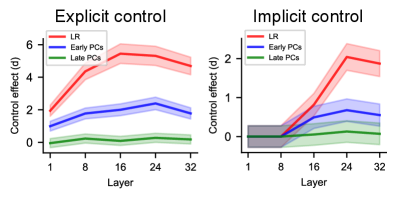
- **Two Subplots**:
1. **Explicit Control** (Left)
2. **Implicit Control** (Right)
## Axis Labels
- **X-Axis**: "Layer" (Discrete markers at 1, 8, 16, 24, 32)
- **Y-Axis**: "Control effect (d)" (Continuous scale)
## Legends
- **Color-Coded Lines**:
- **Red**: LR (Linear Regression)
- **Blue**: Early PCs (Principal Components)
- **Green**: Late PCs (Principal Components)
## Explicit Control Graph (Left)
### Key Trends
1. **LR (Red Line)**:
- Starts at ~2 (Layer 1)
- Peaks at **6** (Layer 16)
- Declines to ~4 (Layer 32)
- Shaded area (variability) widest at peak (Layer 16)
2. **Early PCs (Blue Line)**:
- Starts at ~1 (Layer 1)
- Peaks at **2.5** (Layer 16)
- Declines to ~1.5 (Layer 32)
- Shaded area narrower than LR
3. **Late PCs (Green Line)**:
- Remains near **0** (Layer 1–32)
- Slight upward fluctuation (~0.2–0.5)
- Minimal shaded variability
## Implicit Control Graph (Right)
### Key Trends
1. **LR (Red Line)**:
- Starts at **0** (Layer 1)
- Sharp rise to **2** (Layer 16)
- Declines to **1.5** (Layer 32)
- Shaded area widest at peak (Layer 16)
2. **Early PCs (Blue Line)**:
- Starts at **0** (Layer 1)
- Peaks at **1** (Layer 16)
- Declines to **0.5** (Layer 32)
- Shaded area narrower than LR
3. **Late PCs (Green Line)**:
- Remains near **0** (Layer 1–32)
- Slight upward fluctuation (~0.1–0.2)
- Minimal shaded variability
## Cross-Referenced Observations
- **Legend Consistency**:
- Red (LR) consistently highest in both graphs.
- Blue (Early PCs) intermediate in both.
- Green (Late PCs) minimal in both.
- **Layer-Specific Peaks**:
- Both graphs show peak control effects at **Layer 16**.
- Explicit control exhibits higher magnitude effects overall.
## Notes
- Shaded regions represent confidence intervals or variability.
- No data tables present; trends inferred from line trajectories.
- Axis markers (1, 8, 16, 24, 32) suggest layer groupings (e.g., early, mid, late layers).