## Line Chart: LM Loss vs. MoBA Block Segmentation Settings
### Overview
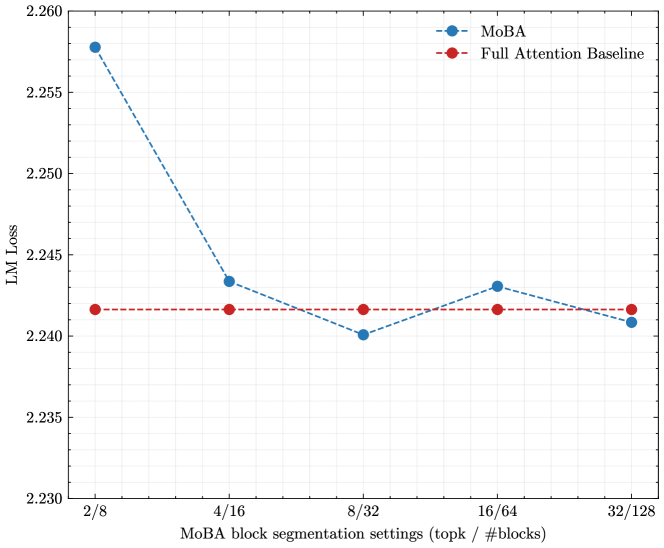
The image displays a line chart comparing the Language Model (LM) Loss of two methods, "MoBA" and a "Full Attention Baseline," across five different block segmentation settings. The chart illustrates how the performance (measured by loss) of the MoBA method changes with different configurations, relative to a constant baseline.
### Components/Axes
* **Chart Type:** Line chart with markers.
* **X-Axis:**
* **Label:** `MoBA block segmentation settings (topk / #blocks)`
* **Categories/Ticks:** `2/8`, `4/16`, `8/32`, `16/64`, `32/128`. These represent paired settings for a parameter called "topk" and the number of blocks ("#blocks").
* **Y-Axis:**
* **Label:** `LM Loss`
* **Scale:** Linear, ranging from 2.230 to 2.260, with major ticks at intervals of 0.005.
* **Legend:**
* **Position:** Top-right corner of the plot area.
* **Series 1:** `MoBA` - Represented by a blue dashed line (`--`) with circular markers (`o`).
* **Series 2:** `Full Attention Baseline` - Represented by a red dashed line (`--`) with circular markers (`o`).
### Detailed Analysis
**Data Series: Full Attention Baseline (Red Line)**
* **Trend:** The line is perfectly horizontal, indicating a constant loss value across all x-axis categories.
* **Data Points (Approximate):**
* At `2/8`: LM Loss ≈ 2.242
* At `4/16`: LM Loss ≈ 2.242
* At `8/32`: LM Loss ≈ 2.242
* At `16/64`: LM Loss ≈ 2.242
* At `32/128`: LM Loss ≈ 2.242
**Data Series: MoBA (Blue Line)**
* **Trend:** The line shows a significant initial decrease, followed by a shallow valley and a slight rise, before a final small decrease. It starts well above the baseline, dips below it, and ends very close to it.
* **Data Points (Approximate):**
* At `2/8`: LM Loss ≈ 2.258 (Highest point, significantly above baseline).
* At `4/16`: LM Loss ≈ 2.243 (Sharp decrease, now slightly above baseline).
* At `8/32`: LM Loss ≈ 2.240 (Lowest point, slightly below baseline).
* At `16/64`: LM Loss ≈ 2.243 (Slight increase, back to being slightly above baseline).
* At `32/128`: LM Loss ≈ 2.241 (Final small decrease, ending very close to, but marginally below, the baseline).
### Key Observations
1. **Convergence:** The MoBA method's loss converges toward the Full Attention Baseline as the block segmentation settings increase (moving right on the x-axis). The largest performance gap is at the simplest setting (`2/8`).
2. **Optimal Setting:** The lowest loss for MoBA is achieved at the `8/32` setting, where it performs marginally better than the constant baseline.
3. **Non-Monotonic Behavior:** The improvement in MoBA's loss is not strictly linear or monotonic. After the optimal `8/32` point, the loss increases slightly at `16/64` before decreasing again at `32/128`.
4. **Baseline Stability:** The Full Attention Baseline serves as a fixed reference point, showing no sensitivity to the "MoBA block segmentation settings" parameter, which is expected as it likely represents a different, non-segmented attention mechanism.
### Interpretation
This chart demonstrates the trade-off between computational configuration and model performance for the MoBA method. The "topk / #blocks" setting appears to control a granularity or sparsity parameter in the attention mechanism.
* **What the data suggests:** Very coarse segmentation (`2/8`) leads to a significant performance penalty (higher loss). Increasing the segmentation granularity (moving to `4/16` and `8/32`) rapidly improves performance, bringing MoBA to a level competitive with, and even slightly surpassing, the full attention baseline. The performance plateau and slight fluctuation at higher settings (`16/64`, `32/128`) suggest diminishing returns or potential optimization challenges at very fine granularities.
* **How elements relate:** The x-axis represents a design choice in the MoBA algorithm. The y-axis measures the consequence of that choice on model accuracy (loss). The red baseline defines the target performance level. The blue line's trajectory shows that MoBA can match full attention's quality with appropriately tuned segmentation, validating its potential as an efficient alternative.
* **Notable anomaly:** The slight increase in loss at `16/64` after the low at `8/32` is interesting. It could indicate a suboptimal interaction between the "topk" and "#blocks" parameters at that specific ratio, or simply noise in the experimental results. It highlights that "more" (finer segmentation) is not always linearly "better."