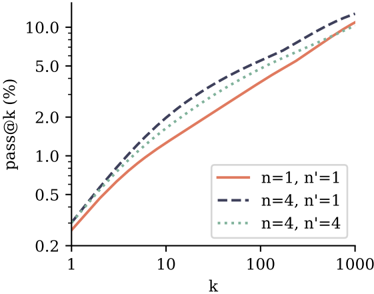
## Chart: Pass@k vs. k for different n and n' values
### Overview
The image is a line chart showing the relationship between "pass@k (%)" on the y-axis and "k" on the x-axis for different values of "n" and "n'". There are three lines representing different combinations of n and n': (n=1, n'=1), (n=4, n'=1), and (n=4, n'=4). The chart uses a logarithmic scale for both axes.
### Components/Axes
* **X-axis:** "k" (logarithmic scale), with markers at 1, 10, 100, and 1000.
* **Y-axis:** "pass@k (%)" (logarithmic scale), with markers at 0.2, 0.5, 1.0, 2.0, 5.0, and 10.0.
* **Legend:** Located on the right side of the chart, identifying the lines:
* Solid orange line: "n=1, n'=1"
* Dashed dark blue line: "n=4, n'=1"
* Dotted light green line: "n=4, n'=4"
### Detailed Analysis
* **n=1, n'=1 (Solid Orange Line):**
* Trend: The line slopes upward, indicating that "pass@k (%)" increases as "k" increases.
* Data Points:
* k=1, pass@k ≈ 0.25%
* k=10, pass@k ≈ 1.0%
* k=100, pass@k ≈ 4.0%
* k=1000, pass@k ≈ 10.0%
* **n=4, n'=1 (Dashed Dark Blue Line):**
* Trend: The line slopes upward, indicating that "pass@k (%)" increases as "k" increases.
* Data Points:
* k=1, pass@k ≈ 0.3%
* k=10, pass@k ≈ 1.5%
* k=100, pass@k ≈ 5.5%
* k=1000, pass@k ≈ 11.0%
* **n=4, n'=4 (Dotted Light Green Line):**
* Trend: The line slopes upward, indicating that "pass@k (%)" increases as "k" increases.
* Data Points:
* k=1, pass@k ≈ 0.25%
* k=10, pass@k ≈ 1.2%
* k=100, pass@k ≈ 4.5%
* k=1000, pass@k ≈ 10.0%
### Key Observations
* For smaller values of k (e.g., k=1), the "n=4, n'=1" configuration yields the highest "pass@k (%)".
* As k increases, the differences between the three configurations become smaller.
* For larger values of k (e.g., k=1000), the "n=4, n'=1" configuration still yields the highest "pass@k (%)", but the "n=1, n'=1" and "n=4, n'=4" configurations are very close.
### Interpretation
The chart illustrates how the "pass@k (%)" metric changes with respect to "k" for different configurations of "n" and "n'". The data suggests that increasing "k" generally improves "pass@k (%)" regardless of the "n" and "n'" values. The "n=4, n'=1" configuration appears to perform slightly better than the other configurations, especially for smaller values of "k". The logarithmic scale indicates that the rate of increase in "pass@k (%)" slows down as "k" increases. The values of n and n' seem to have a more significant impact at lower values of k.