\n
## Line Chart: pass@k Performance Across Parameter Configurations
### Overview
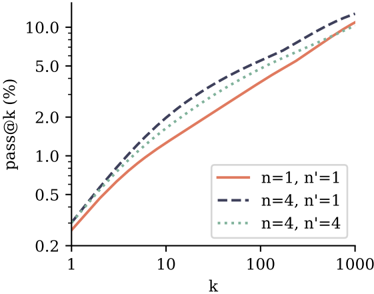
The image displays a line chart comparing the performance of three different parameter configurations (n, n') on a metric called "pass@k (%)". The chart uses logarithmic scales on both axes to visualize performance across a wide range of k values. The data suggests an evaluation of some computational or machine learning model's success rate (pass rate) as a function of the number of attempts or samples (k).
### Components/Axes
* **Chart Type:** Line chart with logarithmic X and Y axes.
* **X-Axis:**
* **Label:** `k`
* **Scale:** Logarithmic (base 10).
* **Major Tick Marks:** 1, 10, 100, 1000.
* **Y-Axis:**
* **Label:** `pass@k (%)`
* **Scale:** Logarithmic.
* **Major Tick Marks:** 0.2, 0.5, 1.0, 2.0, 5.0, 10.0.
* **Legend:**
* **Position:** Bottom-right corner of the plot area.
* **Entries:**
1. **Solid Red Line:** `n=1, n'=1`
2. **Dashed Black Line:** `n=4, n'=1`
3. **Dotted Green Line:** `n=4, n'=4`
### Detailed Analysis
The chart plots three data series, each showing a monotonically increasing trend where `pass@k (%)` rises as `k` increases. The relationship appears roughly linear on this log-log plot, indicating a power-law relationship (`pass@k ∝ k^α`).
**Trend Verification & Data Point Extraction (Approximate Values):**
1. **Series: `n=1, n'=1` (Solid Red Line)**
* **Trend:** Starts as the lowest-performing configuration at low `k` but shows a steady, consistent upward slope. It converges with the other lines at the highest `k` value.
* **Approximate Data Points:**
* At k=1: ~0.3%
* At k=10: ~1.5%
* At k=100: ~5.0%
* At k=1000: ~10.0%
2. **Series: `n=4, n'=1` (Dashed Black Line)**
* **Trend:** This is the highest-performing configuration across the entire range of `k`. It has the steepest initial slope and maintains a lead, though the gap narrows at very high `k`.
* **Approximate Data Points:**
* At k=1: ~0.4%
* At k=10: ~2.5%
* At k=100: ~7.0%
* At k=1000: ~11.0%
3. **Series: `n=4, n'=4` (Dotted Green Line)**
* **Trend:** Performs between the other two configurations. It starts higher than the `n=1, n'=1` line but lower than the `n=4, n'=1` line, and maintains this middle position throughout.
* **Approximate Data Points:**
* At k=1: ~0.35%
* At k=10: ~2.0%
* At k=100: ~6.0%
* At k=1000: ~10.5%
### Key Observations
1. **Parameter Impact:** Increasing the parameter `n` from 1 to 4 (comparing red vs. black/green lines) provides a significant boost to `pass@k` performance, especially at lower to mid-range `k` values.
2. **Trade-off with n':** For a fixed `n=4`, increasing `n'` from 1 to 4 (comparing black vs. green lines) results in a slight but consistent decrease in performance.
3. **Convergence at High k:** All three configurations converge to a similar pass rate (approximately 10-11%) when `k` reaches 1000, suggesting diminishing returns or a performance ceiling for this metric at very high sample counts.
4. **Log-Log Linearity:** The near-linear appearance on the log-log plot indicates that the pass rate improves as a power function of `k`.
### Interpretation
This chart likely evaluates the efficiency of a generative model or a code synthesis system where `pass@k` measures the probability that at least one of `k` generated samples is correct. The parameters `n` and `n'` could represent aspects like model size, number of refinement steps, or ensemble size.
The data demonstrates a clear **Peircean investigative insight**: there is a positive but non-linear relationship between computational budget (`k`) and success rate. More importantly, it reveals a **parameter hierarchy**: the configuration `n=4, n'=1` is optimal within the tested set. The fact that `n=4, n'=4` underperforms `n=4, n'=1` suggests a potential **over-constraint or interference effect** when both parameters are increased, which is a critical anomaly for system tuning. The convergence at high `k` implies that for applications where extensive sampling is feasible, the choice of `n` and `n'` becomes less critical, but for low-latency or resource-constrained settings (low `k`), selecting `n=4, n'=1` is crucial for maximizing performance.