## Line Graph: pass@k (%) vs. k
### Overview
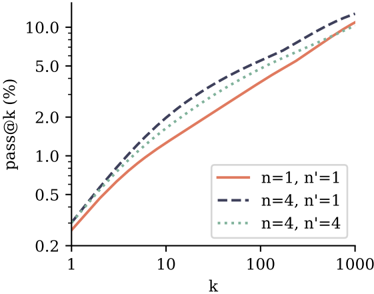
The image depicts a line graph comparing the performance metric "pass@k (%)" across different values of `k` (x-axis) for three configurations of parameters `n` and `n'`. The y-axis represents the percentage of successful outcomes, while the x-axis spans a logarithmic scale from 1 to 1000. Three distinct lines represent different parameter combinations, with the legend positioned in the bottom-right corner.
---
### Components/Axes
- **Y-Axis**: Labeled "pass@k (%)", ranging from 0.2 to 10.0 in increments of 1.0.
- **X-Axis**: Labeled "k", spanning a logarithmic scale from 1 to 1000.
- **Legend**: Located in the bottom-right corner, with three entries:
- **Solid Red**: `n=1, n'=1`
- **Dashed Black**: `n=4, n'=1`
- **Dotted Green**: `n=4, n'=4`
---
### Detailed Analysis
1. **Solid Red Line (`n=1, n'=1`)**:
- Starts near the origin (0.2% at `k=1`).
- Gradually increases, reaching ~5.0% at `k=100` and ~9.5% at `k=1000`.
- Exhibits the slowest growth rate among the three lines.
2. **Dashed Black Line (`n=4, n'=1`)**:
- Begins slightly above the red line (0.3% at `k=1`).
- Outperforms the red line, reaching ~6.5% at `k=100` and ~10.0% at `k=1000`.
- Shows a steeper slope than the red line but less than the green line.
3. **Dotted Green Line (`n=4, n'=4`)**:
- Starts at ~0.4% at `k=1`.
- Demonstrates the steepest growth, surpassing the black line by `k=10`.
- Reaches ~9.0% at `k=100` and ~10.0% at `k=1000`.
---
### Key Observations
- All three lines exhibit **monotonic growth**, with no declines observed across the range of `k`.
- The **green line (`n=4, n'=4`)** consistently outperforms the other two configurations, suggesting that higher values of `n` and `n'` improve performance.
- The **red line (`n=1, n'=1`)** lags significantly behind, indicating that lower parameter values result in poorer outcomes.
- The logarithmic scale on the x-axis emphasizes performance differences at larger `k` values (e.g., `k=1000`).
---
### Interpretation
The graph demonstrates that increasing both `n` and `n'` parameters enhances the "pass@k" metric, likely reflecting improved efficiency or accuracy in a system (e.g., recommendation algorithms, search engines, or classification models). The logarithmic x-axis highlights that performance gains are more pronounced at higher `k` thresholds, where the system's ability to handle larger-scale data becomes critical. The divergence between configurations suggests that parameter tuning (specifically increasing `n` and `n'`) is crucial for optimizing outcomes in scenarios requiring high recall or precision at scale. No outliers or anomalies are present, as all lines follow predictable growth patterns.