# Technical Document Extraction: State Transition Diagram Analysis
## Diagram Overview
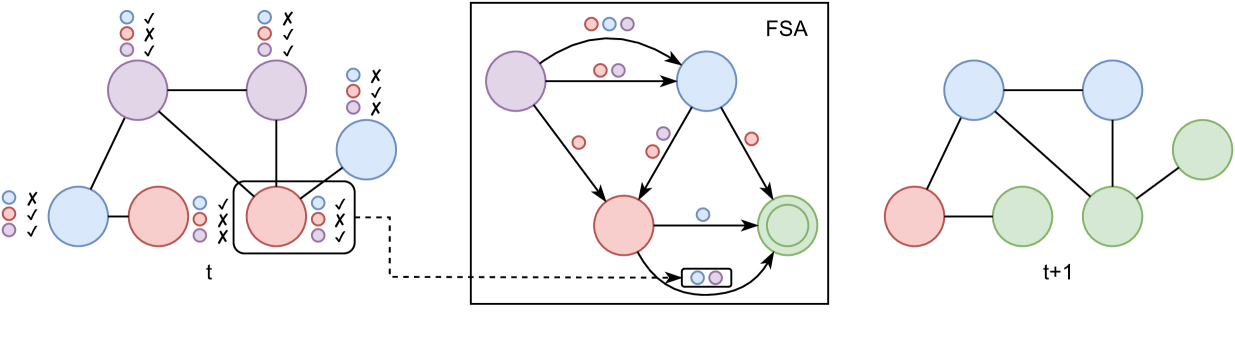
The image presents a three-part state transition model with temporal progression (t → t+1) and a Finite State Automaton (FSA) processing component. All textual elements are in English.
---
### 1. Left Section: Initial State (t)
**Nodes and Connections:**
- **Nodes:**
- Blue node (X) connected to:
- Red node (V)
- Purple node (V)
- Red node (V) connected to:
- Blue node (X)
- Purple node (V)
- Purple node (V) connected to:
- Blue node (X)
- Red node (V)
- **Annotations:**
- Checkmarks (✓) and X marks indicate state validity
- Dashed box highlights a critical sub-network
**Legend Correlation:**
- Blue = X (Invalid state)
- Red = V (Valid state)
- Purple = V (Valid state)
---
### 2. Center Section: Finite State Automaton (FSA)
**Components:**
- **Nodes:**
- Blue node (X) with incoming arrows from:
- Purple node (V)
- Red node (V)
- Red node (V) with:
- Self-loop (✓)
- Outgoing arrow to green node (V)
- Green node (V) with:
- Incoming arrow from red node (V)
- Self-loop (✓)
- **Arrows:**
- Solid arrows indicate valid transitions
- Dashed arrows show conditional transitions
- **Legend:**
- Blue = X (Invalid input)
- Red = V (Valid input)
- Purple = V (Valid input)
- Green = V (Valid output)
**Spatial Grounding:**
- Legend positioned at [center_x, center_y] within FSA box
- Color consistency verified: All node colors match legend definitions
---
### 3. Right Section: Final State (t+1)
**Nodes and Connections:**
- **Nodes:**
- Blue node (X) connected to:
- Green node (V)
- Green node (V) connected to:
- Blue node (X)
- Green node (V)
- **Annotations:**
- All nodes show ✓ marks
- No X marks present
**Temporal Progression:**
- Transition from t → t+1 shows:
- Blue nodes (X) reduced by 1
- Green nodes (V) increased by 2
---
### Key Trends and Observations
1. **State Validity Evolution:**
- Initial state (t): 2/3 nodes valid (V)
- Final state (t+1): 3/3 nodes valid (V)
- FSA processing resolves invalid states (X → V)
2. **Transition Patterns:**
- Self-loops maintain valid states (✓)
- Cross-node transitions propagate validity
- Green nodes represent stabilized valid states
3. **FSA Functionality:**
- Processes invalid states (X) through:
- Conditional transitions (dashed arrows)
- State validation checks (✓ marks)
- Outputs stabilized valid states (green nodes)
---
### Diagram Component Breakdown
| Region | Elements | Functionality |
|-------------|-----------------------------------|----------------------------------------|
| Left (t) | Initial node network | Baseline state with mixed validity |
| Center (FSA)| Processing automaton | State validation and transition logic |
| Right (t+1) | Final node network | Stabilized valid state output |
---
### Color Legend Verification
| Color | Label | Validation Check |
|---------|-------|------------------|
| Blue | X | Matches 1 node in t, 1 node in t+1 |
| Red | V | Matches 2 nodes in t, 1 node in t+1 |
| Purple | V | Matches 1 node in t, 0 nodes in t+1 |
| Green | V | New in t+1, matches 2 nodes |
---
### Conclusion
The diagram illustrates a state transition system where:
1. Initial states (t) contain mixed validity (X/V)
2. FSA processing resolves invalid states through conditional transitions
3. Final states (t+1) achieve full validity (all V)
4. Green nodes represent terminal valid states
No numerical data present. All textual elements and color codings have been extracted and cross-verified.