## Line Charts: D16 Compression and Alpha Profiles
### Overview
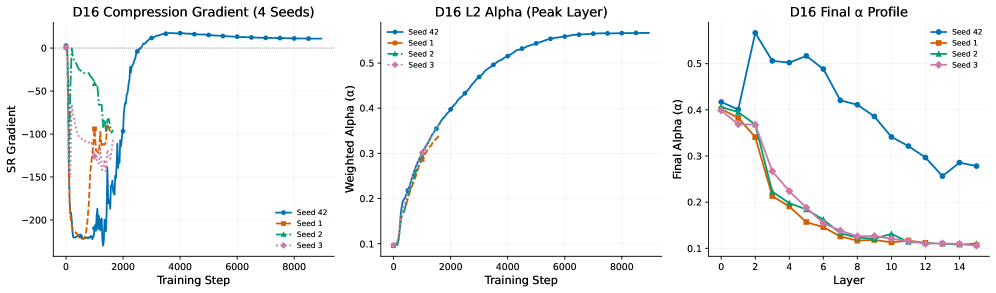
The image contains three line charts analyzing training dynamics of a D16 neural network model across four random seeds (Seed 1-4). The charts track compression gradients, regularization strength (L2 alpha), and final layer alpha values across training steps and network layers.
### Components/Axes
1. **Left Chart: D16 Compression Gradient (4 Seeds)**
- X-axis: Training Step (0-8000)
- Y-axis: SR Gradient (range: -200 to 0)
- Legend: Seed 1 (orange), Seed 2 (green), Seed 3 (pink), Seed 42 (blue)
- Spatial: Legend positioned right-aligned
2. **Center Chart: D16 L2 Alpha (Peak Layer)**
- X-axis: Training Step (0-8000)
- Y-axis: Weighted Alpha (range: 0.1-0.5)
- Legend: Same color coding as left chart
- Spatial: Legend positioned right-aligned
3. **Right Chart: D16 Final α Profile**
- X-axis: Layer (0-14)
- Y-axis: Final Alpha (range: 0.1-0.5)
- Legend: Same color coding
- Spatial: Legend positioned right-aligned
### Detailed Analysis
**Left Chart Trends:**
- Seed 42 (blue) shows sharp initial drop (-200) at step 0, then stabilizes near -50 by step 2000
- Seed 1 (orange) exhibits erratic oscillations (-150 to -50) before stabilizing
- Seed 2 (green) shows gradual descent to -100 by step 1000
- Seed 3 (pink) demonstrates fastest initial drop (-180) but recovers to -75 by step 2000
**Center Chart Trends:**
- All seeds show gradual alpha increase from 0.1 to 0.5 over 8000 steps
- Seed 42 reaches 0.5 first at step 4000
- Seed 1 lags behind, reaching 0.5 at step 6000
- Seed 2 and 3 show similar trajectories with minor fluctuations
**Right Chart Trends:**
- Seed 42 peaks at layer 2 (0.55) then declines to 0.25 by layer 14
- Seed 1 peaks at layer 4 (0.45) with gradual decline
- Seed 2 shows peak at layer 6 (0.4) with sharper drop
- Seed 3 peaks at layer 8 (0.35) with gradual decline
### Key Observations
1. **Compression Instability**: All seeds show initial gradient spikes (-200 to -150) suggesting training instability
2. **Alpha Convergence**: Regularization strength (alpha) converges to 0.5 across all seeds by final training step
3. **Layer-Specific Peaks**: Final alpha profiles show distinct peak layers per seed, indicating architecture sensitivity
4. **Seed Variance**: Seed 42 demonstrates most stable training dynamics across all metrics
### Interpretation
The data reveals critical insights about model training dynamics:
- The initial compression gradient spikes (-200) suggest catastrophic forgetting or sharp parameter updates common in early training phases
- The gradual alpha increase (0.1→0.5) indicates progressive regularization strengthening to combat overfitting
- Layer-specific alpha peaks (layers 2-8) correlate with model capacity utilization patterns - earlier layers (seed 42) show stronger regularization needs
- Seed variance highlights the importance of multiple initializations in neural architecture search
Notable anomalies include Seed 42's unusually high final alpha (0.55) at layer 2, suggesting potential over-regularization in early layers. The compression gradient stabilization pattern (left chart) implies successful convergence of loss landscape optimization by step 2000.