\n
## Diagram: R-Sharding Architecture
### Overview
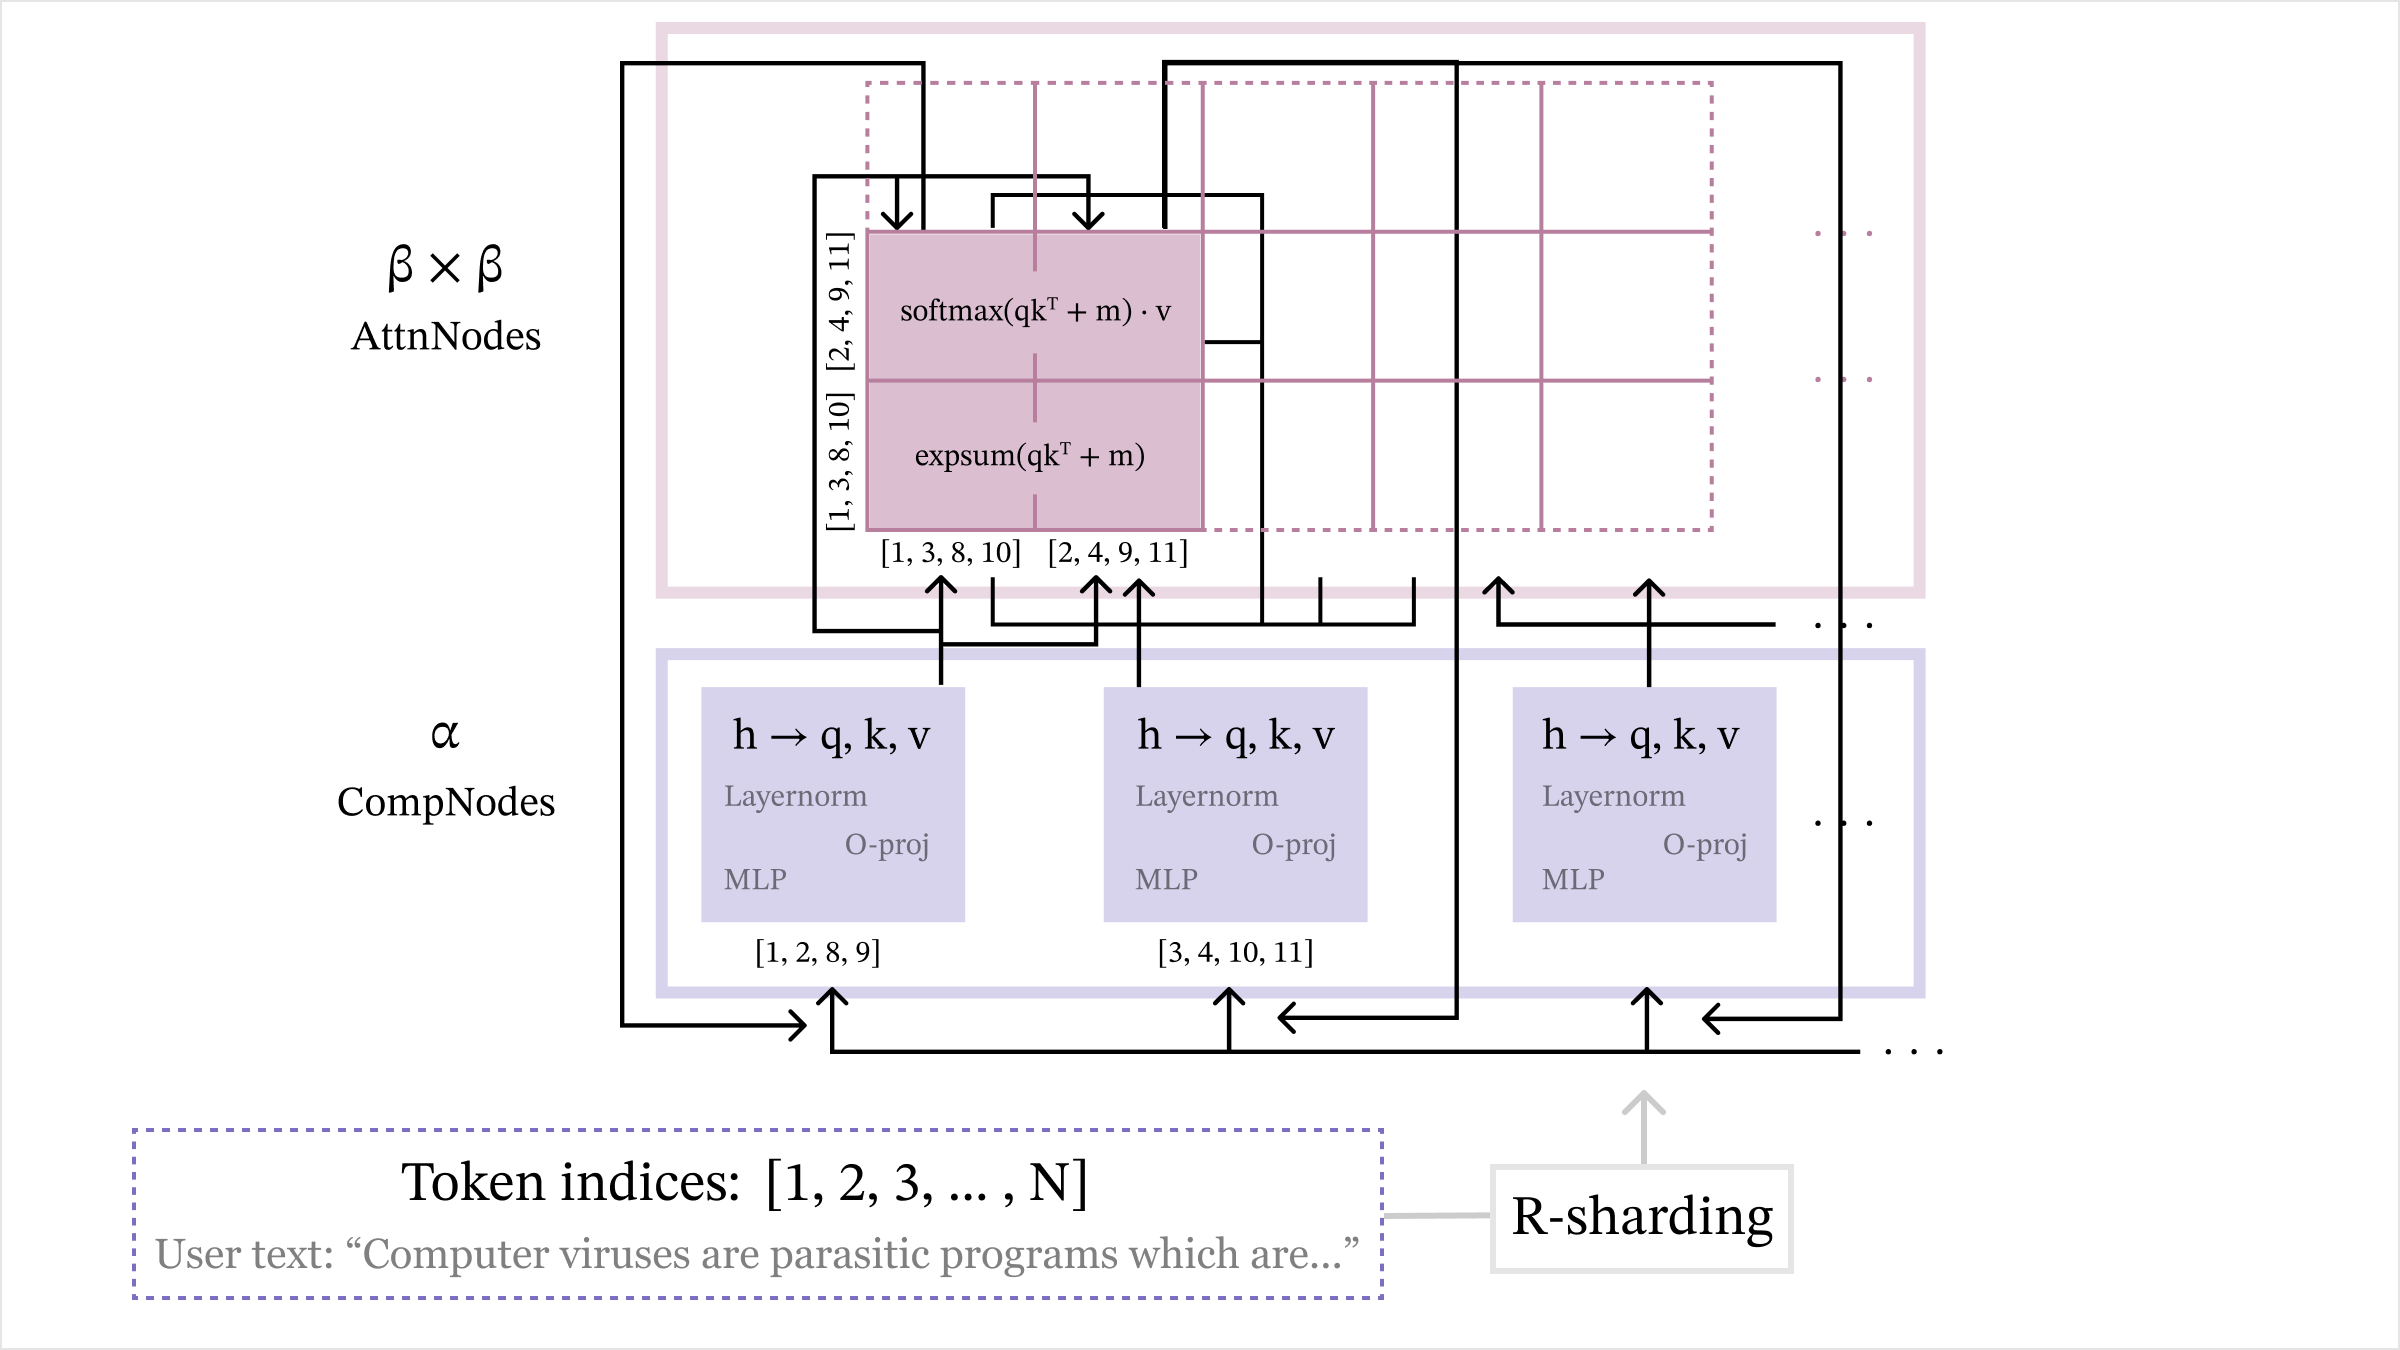
The image depicts a diagram of an R-Sharding architecture, likely related to a neural network or large language model. It illustrates the interaction between AttnNodes (Attention Nodes) and CompNodes (Computation Nodes) with data flowing between them. The diagram highlights the processing steps within each node type and the overall data flow.
### Components/Axes
The diagram consists of the following key components:
* **AttnNodes:** Represented by a purple rectangular block labeled "β x β AttnNodes" in the top-left corner.
* **CompNodes:** Represented by a blue rectangular block labeled "α CompNodes" at the bottom.
* **Data Flow Arrows:** Indicate the direction of data processing.
* **Processing Blocks:** Within CompNodes, blocks labeled "h → q, k, v", "Layernorm", "O-proj", and "MLP" represent different processing layers.
* **Mathematical Operations:** "softmax(qkᵀ + m) ⋅ v" and "expsum(qkᵀ + m)" are shown within the AttnNodes block.
* **Token Indices:** A yellow box at the bottom labeled "Token indices: [1, 2, 3, ..., N]".
* **User Text:** A gray box at the bottom labeled "User text: “Computer viruses are parasitic programs which are…”".
* **R-Sharding:** A label indicating the overall architecture.
* **Index Groups:** Several index groups are shown in brackets, such as "[1, 3, 8, 10]", "[2, 4, 9, 11]", "[1, 2, 8, 9]", "[3, 4, 10, 11]".
### Detailed Analysis or Content Details
The diagram shows a parallel processing structure.
1. **CompNodes:**
* Input 'h' is transformed into 'q, k, v'.
* 'q, k, v' are then processed through a Layernorm layer.
* The output of Layernorm is projected using "O-proj".
* Finally, the projected output is passed through an MLP (Multi-Layer Perceptron).
* The CompNodes are associated with index groups [1, 2, 8, 9] and [3, 4, 10, 11].
2. **AttnNodes:**
* The output from the CompNodes is fed into the AttnNodes.
* Within AttnNodes, the operation "softmax(qkᵀ + m) ⋅ v" is performed.
* Another operation "expsum(qkᵀ + m)" is also present.
* The AttnNodes are associated with index groups [1, 3, 8, 10] and [2, 4, 9, 11].
3. **R-Sharding:**
* The entire process is labeled as "R-Sharding".
* The diagram suggests a sharding strategy where the input tokens (indexed from 1 to N) are distributed across multiple CompNodes and AttnNodes.
### Key Observations
* The diagram illustrates a parallel processing architecture with distinct computation and attention components.
* The use of index groups suggests a partitioning of the input data across different nodes.
* The mathematical operations within AttnNodes indicate an attention mechanism is being employed.
* The diagram does not provide specific numerical values or performance metrics. It is a conceptual representation of the architecture.
* The user text provides context, suggesting the model is processing natural language.
### Interpretation
The diagram represents a sharded architecture for processing sequential data, likely text, using attention mechanisms. The R-Sharding approach distributes the computational load across multiple CompNodes and AttnNodes, potentially improving scalability and performance. The index groups indicate how the input tokens are partitioned and processed in parallel. The attention mechanism, represented by the "softmax(qkᵀ + m) ⋅ v" operation, allows the model to focus on relevant parts of the input sequence. The user text suggests the model is designed for natural language processing tasks. The diagram is a high-level overview and does not provide details on the specific implementation or training process. The diagram is a conceptual illustration of a distributed processing system, and the exact details of the sharding strategy and attention mechanism would require further information. The diagram suggests a model capable of handling long sequences by distributing the computation across multiple nodes.