## [Diagram]: Parallelized Attention Mechanism with R-Sharding
### Overview
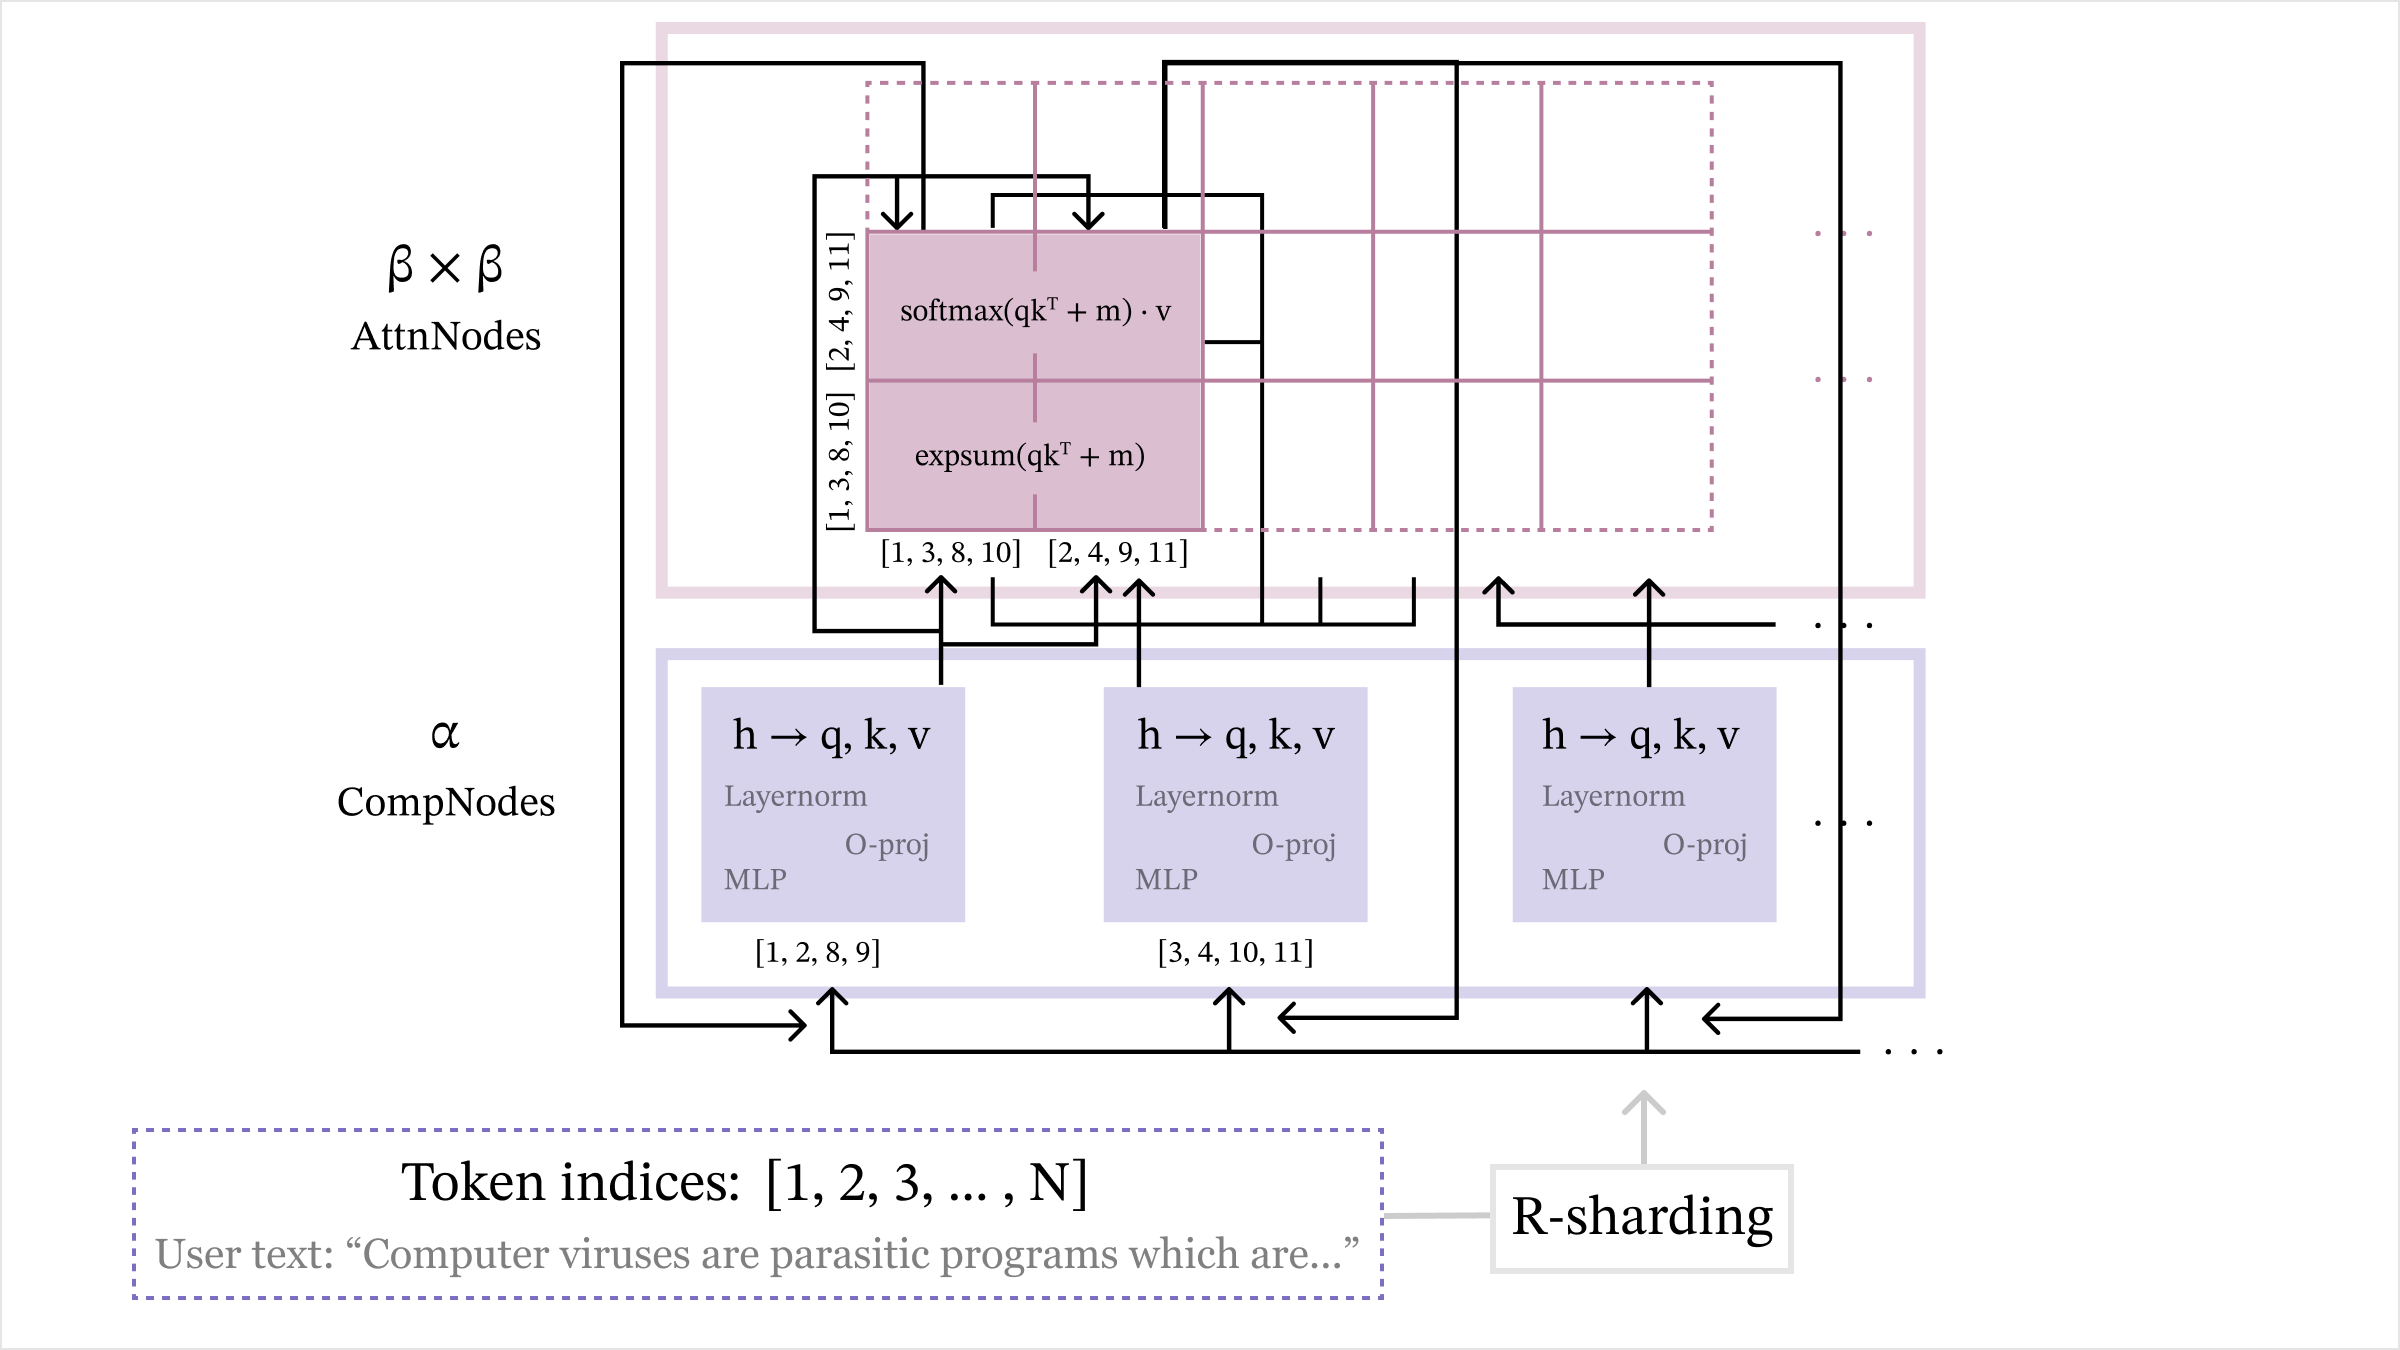
This image is a technical diagram illustrating a parallelized attention mechanism architecture, likely for a transformer-based neural network. It depicts how input tokens are processed through computational nodes (CompNodes) and attention nodes (AttnNodes) using a sharding strategy labeled "R-sharding." The diagram emphasizes the distribution of token indices across different processing units and the mathematical operations involved in attention computation.
### Components/Axes
The diagram is organized into three primary horizontal layers or regions:
1. **Top Region (Pink Outline):** Labeled **"β × β AttnNodes"**. This represents a grid of attention computation nodes.
2. **Middle Region (Purple Outline):** Labeled **"α CompNodes"**. This represents a set of computational nodes.
3. **Bottom Region (Dashed Purple Outline):** Contains the input data and sharding mechanism.
* **Text:** `Token indices: [1, 2, 3, ... , N]`
* **Text:** `User text: “Computer viruses are parasitic programs which are...”`
* **Label:** `R-sharding` (in a grey box with an arrow pointing upwards to the CompNodes).
**Detailed Component Labels & Text:**
* **Within the AttnNodes (Pink) Grid:**
* A specific node is highlighted with two mathematical expressions:
* `softmax(qkᵀ + m) · v`
* `expsum(qkᵀ + m)`
* This node is associated with two sets of token indices, placed vertically and horizontally:
* Vertical (left side): `[1, 3, 8, 10]` and `[2, 4, 9, 11]`
* Horizontal (bottom): `[1, 3, 8, 10]` and `[2, 4, 9, 11]`
* Arrows indicate data flow into this node from the CompNodes below.
* **Within the CompNodes (Purple) Region:**
* Three identical purple boxes are shown, each representing a CompNode. Each contains:
* `h → q, k, v` (indicating a projection from hidden state `h` to query, key, and value vectors).
* `Layernorm`
* `MLP`
* `O-proj` (Output projection).
* Each CompNode is associated with a specific set of token indices:
* Leftmost node: `[1, 2, 8, 9]`
* Middle node: `[3, 4, 10, 11]`
* Rightmost node: (Implied continuation with `...`).
* **Data Flow Arrows:**
* Arrows originate from the `R-sharding` block and point upwards to the CompNodes.
* Arrows connect the CompNodes to the AttnNodes grid, showing how processed data (q, k, v) is sent for attention computation.
* Arrows within the AttnNodes grid show the flow between attention computation blocks.
### Detailed Analysis
The diagram details a specific parallelization strategy for transformer attention.
1. **Input & Sharding:** The process begins with a sequence of `N` tokens (exemplified by the user text about computer viruses). The `R-sharding` mechanism partitions these token indices into groups.
2. **Computational Nodes (α CompNodes):** The sharded token indices are distributed to different CompNodes. For example:
* One node handles tokens `[1, 2, 8, 9]`.
* Another handles tokens `[3, 4, 10, 11]`.
Each CompNode performs standard transformer block operations: LayerNorm, MLP, and projections to generate query (q), key (k), and value (v) vectors for its assigned tokens.
3. **Attention Nodes (β × β AttnNodes):** The q, k, v vectors from the CompNodes are fed into a 2D grid of attention nodes. The highlighted node performs the core attention computation: `softmax(qkᵀ + m) · v`. The `expsum(qkᵀ + m)` likely represents a numerically stable computation of the softmax denominator. This node operates on a specific subset of tokens from both the query side (vertical indices `[1, 3, 8, 10]` and `[2, 4, 9, 11]`) and the key side (horizontal indices `[1, 3, 8, 10]` and `[2, 4, 9, 11]`), indicating a block-sparse or partitioned attention pattern.
4. **Parallelism:** The structure implies two levels of parallelism: across the `α` CompNodes (processing different token shards) and across the `β × β` AttnNodes (computing attention for different token pairs).
### Key Observations
* **Non-Contiguous Token Sharding:** The token indices assigned to nodes are not contiguous (e.g., `[1, 2, 8, 9]`). This suggests a sharding strategy designed for load balancing or specific communication patterns, rather than simple sequential chunking.
* **Block-Sparse Attention Pattern:** The attention node operates on specific, non-adjacent blocks of tokens (e.g., indices 1,3,8,10 vs. 2,4,9,11). This is a key feature, reducing computational complexity from O(N²) to something more manageable.
* **Hierarchical Abstraction:** The diagram clearly separates the "computation" phase (CompNodes) from the "attention" phase (AttnNodes), which is a common pattern in distributed transformer implementations.
* **Example Data:** The inclusion of a concrete user text snippet grounds the abstract token indices in a real-world example.
### Interpretation
This diagram illustrates a sophisticated method for scaling transformer models. The core innovation appears to be the **R-sharding** strategy, which distributes tokens in a non-contiguous manner to computational nodes. This is likely designed to optimize communication overhead or memory access patterns in a distributed computing environment.
The subsequent **block-sparse attention** mechanism (evident from the specific token index sets in the AttnNode) drastically reduces the computational and memory burden of the self-attention operation, which is the primary bottleneck in long-sequence processing. By only computing attention between predefined blocks of tokens (e.g., tokens 1,3,8,10 attending to themselves and each other), the model can handle much longer sequences (larger `N`) efficiently.
In essence, the diagram depicts a hardware- or system-aware neural network architecture. It's not just about the mathematical operations of attention, but about how to orchestrate those operations across multiple processing units (the `α` and `β` nodes) in a way that minimizes data movement and maximizes parallel throughput. This is a critical design consideration for training and running very large language models.