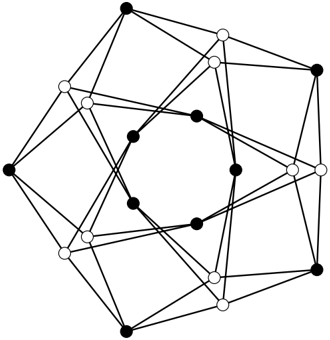
## Diagram: Graph Visualization
### Overview
The image presents a complex graph visualization, featuring nodes (represented by black and white circles) and edges (represented by black lines) connecting these nodes. The graph appears to be a three-dimensional structure, possibly representing a polyhedron or a network.
### Components/Axes
* **Nodes:** Represented by black and white circles. The distribution of black and white nodes seems to follow a pattern, but it's not immediately clear what the pattern represents.
* **Edges:** Represented by black lines connecting the nodes. The edges define the structure and connectivity of the graph.
* **Spatial Arrangement:** The nodes and edges are arranged in a three-dimensional manner, creating a complex visual structure.
### Detailed Analysis
* **Node Distribution:** The nodes are distributed throughout the space, with some concentrated in certain areas. The black nodes appear to form a circular or polygonal shape in the center of the graph.
* **Edge Connectivity:** The edges connect the nodes in a complex network, creating multiple paths between different nodes. The density of edges varies across the graph.
* **Symmetry:** The graph exhibits some degree of symmetry, but it is not perfectly symmetrical.
### Key Observations
* The graph appears to be a representation of a complex network or structure.
* The black nodes form a distinct shape within the graph.
* The connectivity of the graph is high, with multiple paths between nodes.
### Interpretation
The graph visualization likely represents a complex system or structure, such as a molecular structure, a social network, or a computer network. The black nodes may represent a specific subset of nodes with a particular property or function. The high connectivity of the graph suggests that the system is highly interconnected and resilient to failures. Without additional context, it is difficult to determine the exact meaning of the graph.