## Network Diagram: Interconnected Node Structure
### Overview
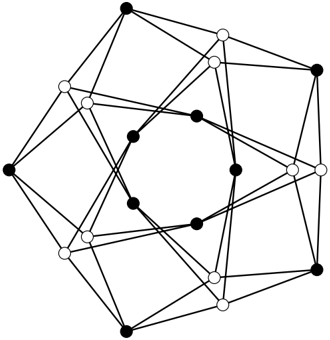
The image depicts a complex network diagram with nodes and edges arranged in a layered, geometric pattern. Nodes are differentiated by color (black and white), and edges form dense, overlapping connections. The structure combines hexagonal symmetry with radial clustering.
### Components/Axes
- **Nodes**:
- **Black Nodes**: Positioned at the outer perimeter, forming a hexagonal boundary.
- **White Nodes**: Located in the inner regions, clustered around a central hexagonal void.
- **Edges**:
- Black edges connect all nodes, creating a web-like structure.
- No explicit labels, legends, or axis markers are visible in the image.
### Detailed Analysis
- **Node Distribution**:
- 12 black nodes form the outer hexagonal ring.
- 18 white nodes occupy the inner regions, with 6 forming a central hexagonal cluster.
- **Edge Density**:
- Edges are uniformly distributed, with no apparent hierarchy or grouping.
- Overlapping edges suggest multiple connections between nodes.
### Key Observations
1. **Symmetry**: The outer black nodes exhibit hexagonal symmetry, while inner white nodes lack strict geometric alignment.
2. **Central Void**: A hexagonal gap exists at the diagram’s center, surrounded by white nodes.
3. **Color Coding**: Black nodes dominate the periphery, while white nodes occupy transitional and central zones.
### Interpretation
The diagram likely represents a hierarchical or modular system:
- **Black Nodes**: Could symbolize boundary or interface components (e.g., sensors, endpoints).
- **White Nodes**: May represent internal processing units or data hubs.
- **Edge Density**: High connectivity implies redundancy or distributed communication pathways.
- **Central Void**: The empty hexagon might indicate a core processing zone or a conceptual "kernel" of the system.
**Note**: No textual labels, numerical data, or explicit legends are present. The interpretation relies on spatial patterns and common diagrammatic conventions for network structures.