## 3D Scatter Plot: l, k, and l - floor(k/2)
### Overview
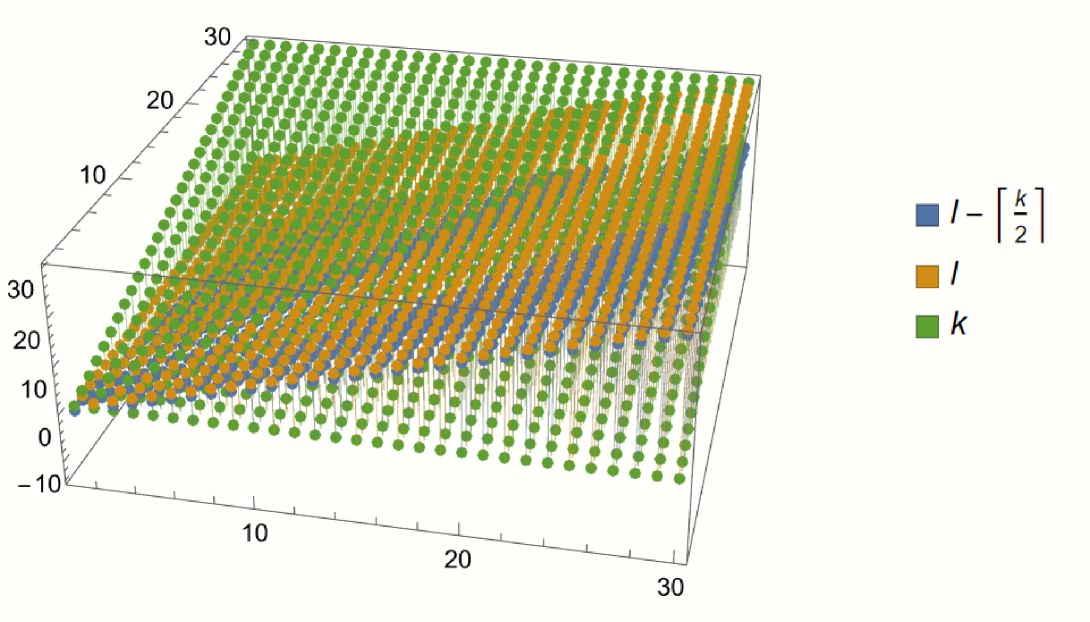
The image is a 3D scatter plot visualizing the relationship between three variables: `l`, `k`, and `l - floor(k/2)`. The plot displays data points for each variable combination, with `l` and `k` ranging from approximately 0 to 30. The plot uses color-coding to distinguish the three variables: blue for `l - floor(k/2)`, orange for `l`, and green for `k`.
### Components/Axes
* **X-axis:** Ranges from 0 to 30, unlabeled.
* **Y-axis:** Ranges from 0 to 30, unlabeled.
* **Z-axis:** Ranges from -10 to 30, unlabeled.
* **Legend (Top-Right):**
* Blue square: `l - floor(k/2)`
* Orange square: `l`
* Green square: `k`
### Detailed Analysis
The data points are arranged in a grid-like structure, suggesting a systematic variation of `l` and `k`.
* **Green (`k`):** The green data points form a flat plane at the top of the plot, indicating that the z-value of these points corresponds directly to the value of `k`. The z-value of the green points is equal to the y-axis value.
* **Orange (`l`):** The orange data points form a plane that slopes upward as both x and y increase. The z-value of the orange points is equal to the x-axis value.
* **Blue (`l - floor(k/2)`):** The blue data points form a more complex surface. For a fixed value of `l`, the z-value decreases as `k` increases. The blue points are always below the orange points.
### Key Observations
* The `k` values (green) are consistently the highest, forming the upper bound of the data.
* The `l` values (orange) are intermediate, forming a plane below the `k` values.
* The `l - floor(k/2)` values (blue) are the lowest, and their distribution is influenced by the floor function, creating a stepped pattern.
### Interpretation
The plot visualizes the relationship between `l`, `k`, and the expression `l - floor(k/2)`. The plot demonstrates that `k` is independent of `l`, and `l` is independent of `k`. The expression `l - floor(k/2)` shows how the value of `l` is reduced based on the value of `k`. The floor function introduces a discrete, stepped behavior to the `l - floor(k/2)` values. The plot is useful for understanding how the value of `l - floor(k/2)` changes as `l` and `k` vary.