## 3D Plot: Relationships Between I, I - [k/2], and k
### Overview
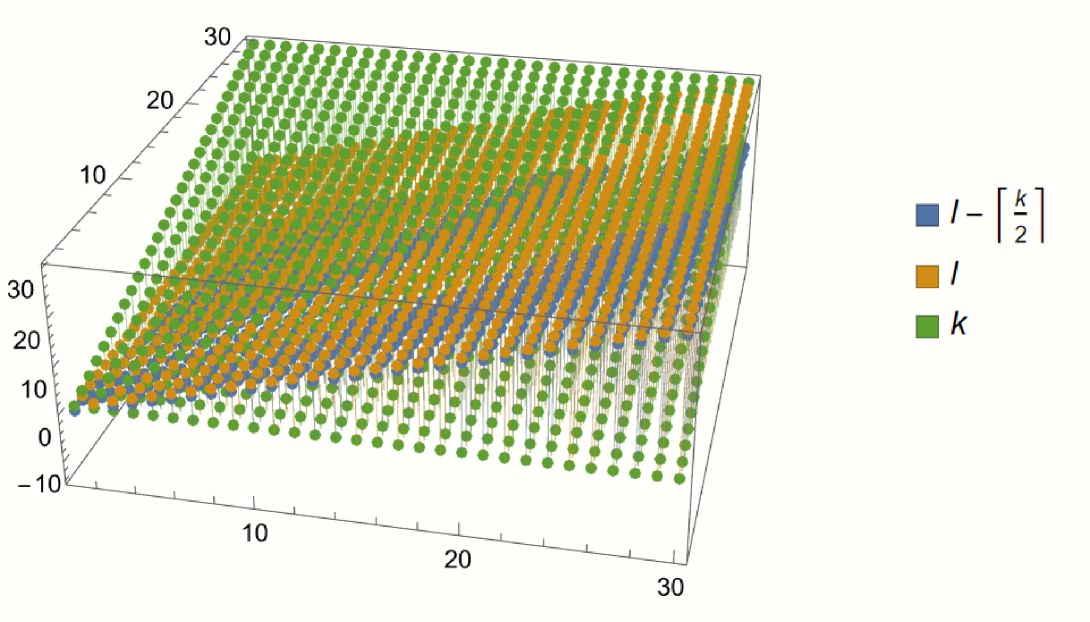
The image depicts a 3D plot with three intersecting planes representing mathematical relationships between variables **I**, **k**, and their combination **I - [k/2]**. The axes are labeled **x**, **y**, and **z**, each ranging from **-10 to 30**. The legend in the top-right corner maps colors to equations: **blue** for **I - [k/2]**, **orange** for **I**, and **green** for **k**. The planes exhibit distinct spatial trends, with the blue plane sloping downward, the orange plane sloping upward, and the green plane remaining flat.
---
### Components/Axes
- **Axes**:
- **x-axis**: Labeled "x", ranging from **-10 to 30**.
- **y-axis**: Labeled "y", ranging from **-10 to 30**.
- **z-axis**: Labeled "z", ranging from **-10 to 30**.
- **Legend**: Positioned in the **top-right corner**, with:
- **Blue**: Equation **I - [k/2]** (diagonal plane).
- **Orange**: Equation **I** (sloped plane).
- **Green**: Equation **k** (flat plane).
---
### Detailed Analysis
1. **Blue Plane (I - [k/2])**:
- **Equation**: **z = I - [k/2]**.
- **Trend**: Diagonal plane sloping **downward** from the origin (0,0,0) toward negative **z** values as **x** and **y** increase.
- **Key Points**:
- At **x = 0, y = 0**: **z ≈ 0** (intersects origin).
- At **x = 30, y = 30**: **z ≈ -15** (approximate extrapolation based on slope).
- **Spatial Grounding**: Dominates the lower-left quadrant of the plot.
2. **Orange Plane (I)**:
- **Equation**: **z = I**.
- **Trend**: Sloped plane rising **upward** from the origin, with **z** increasing linearly with **x** and **y**.
- **Key Points**:
- At **x = 0, y = 0**: **z ≈ 0** (intersects origin).
- At **x = 30, y = 30**: **z ≈ 30** (approximate extrapolation).
- **Spatial Grounding**: Dominates the upper-right quadrant.
3. **Green Plane (k)**:
- **Equation**: **z = k** (constant).
- **Trend**: Flat plane at **z ≈ 30**, parallel to the **x-y** plane.
- **Key Points**:
- Uniform **z = 30** across all **x** and **y** values.
- **Spatial Grounding**: Covers the top surface of the plot.
---
### Key Observations
- **Intersection**: All three planes intersect at the origin **(0,0,0)**.
- **Color Consistency**: Legend colors match the planes:
- Blue (**I - [k/2]**) aligns with the downward-sloping plane.
- Orange (**I**) aligns with the upward-sloping plane.
- Green (**k**) aligns with the flat plane at **z = 30**.
- **Anomalies**: No outliers or discontinuities observed; all planes are continuous.
---
### Interpretation
The plot illustrates how **I**, **k**, and their adjusted combination (**I - [k/2]**) interact spatially. The **blue plane** (I - [k/2]) suggests a **diminishing relationship** between **I** and **k**, as increasing **k** reduces the value of **I - [k/2]**. The **orange plane** (I) represents a direct proportionality between **I** and spatial coordinates **x/y**, while the **green plane** (k) indicates **k** is a constant parameter independent of **x** and **y**. This could model a system where **I** and **k** are interdependent variables, with **I - [k/2]** acting as a corrected or normalized metric. The flat **k** plane implies **k** is fixed, possibly representing a boundary condition or threshold in the system.