## Line Chart: Interleaved CE vs. Time
### Overview
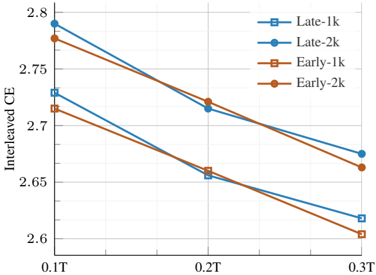
The image is a line chart comparing the Interleaved Cross-Entropy (CE) over time for "Early" and "Late" models, each with two different configurations (1k and 2k). The x-axis represents time, and the y-axis represents the Interleaved CE value.
### Components/Axes
* **X-axis:** Time, labeled as "0.1T", "0.2T", and "0.3T".
* **Y-axis:** Interleaved CE, ranging from 2.6 to 2.8 with increments of 0.05.
* **Legend (Top-Right):**
* Blue Square: "Late-1k"
* Blue Circle: "Late-2k"
* Brown Square: "Early-1k"
* Brown Circle: "Early-2k"
### Detailed Analysis
* **Late-1k (Blue Square):**
* Trend: Decreasing.
* Data Points:
* 0.1T: ~2.73
* 0.2T: ~2.65
* 0.3T: ~2.62
* **Late-2k (Blue Circle):**
* Trend: Decreasing.
* Data Points:
* 0.1T: ~2.79
* 0.2T: ~2.72
* 0.3T: ~2.67
* **Early-1k (Brown Square):**
* Trend: Decreasing.
* Data Points:
* 0.1T: ~2.72
* 0.2T: ~2.65
* 0.3T: ~2.60
* **Early-2k (Brown Circle):**
* Trend: Decreasing.
* Data Points:
* 0.1T: ~2.77
* 0.2T: ~2.72
* 0.3T: ~2.66
### Key Observations
* All four data series show a decreasing trend in Interleaved CE as time increases.
* The "Late-2k" model consistently has the highest Interleaved CE values across all time points.
* The "Early-1k" model consistently has the lowest Interleaved CE values across all time points.
* The "Late" models (1k and 2k) generally have higher Interleaved CE values than the "Early" models (1k and 2k) at each time point.
* The difference in Interleaved CE between the "1k" and "2k" configurations is more pronounced in the "Late" models than in the "Early" models.
### Interpretation
The data suggests that the Interleaved CE decreases over time for both "Early" and "Late" models, indicating that the models are improving their performance as they are trained or used for a longer duration. The "Late" models, particularly the "Late-2k" configuration, exhibit higher Interleaved CE values, suggesting that they might be more complex or have a different learning rate compared to the "Early" models. The "Early-1k" model shows the lowest Interleaved CE, indicating it might be the simplest or most optimized configuration among the four. The consistent decrease in Interleaved CE across all models implies that the models are learning and adapting to the data over time. The difference between the "1k" and "2k" configurations suggests that the model complexity or capacity plays a role in the Interleaved CE performance.