\n
## Line Chart: Interleaved CE vs. Time
### Overview
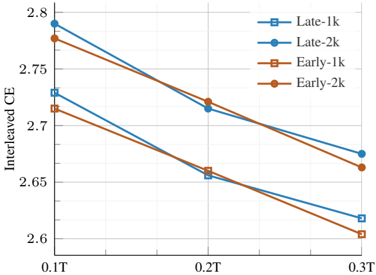
This image presents a line chart illustrating the relationship between Interleaved CE (Coding Efficiency) and Time (T), for four different configurations: Late-1k, Late-2k, Early-1k, and Early-2k. The chart displays a decreasing trend for all configurations as time increases.
### Components/Axes
* **X-axis:** Time (T), ranging from 0.0T to 0.3T, with markers at 0.0T, 0.2T, and 0.3T.
* **Y-axis:** Interleaved CE, ranging from approximately 2.6 to 2.8, with markers at 2.6, 2.65, 2.7, 2.75, and 2.8.
* **Legend:** Located in the top-right corner, identifying the four data series:
* Late-1k (Blue, square markers)
* Late-2k (Blue, circle markers)
* Early-1k (Orange, square markers)
* Early-2k (Orange, circle markers)
### Detailed Analysis
* **Late-1k (Blue squares):** The line slopes downward consistently.
* At 0.0T: Approximately 2.73
* At 0.2T: Approximately 2.67
* At 0.3T: Approximately 2.62
* **Late-2k (Blue circles):** The line slopes downward consistently.
* At 0.0T: Approximately 2.78
* At 0.2T: Approximately 2.72
* At 0.3T: Approximately 2.67
* **Early-1k (Orange squares):** The line slopes downward consistently, and is the lowest of the four lines.
* At 0.0T: Approximately 2.71
* At 0.2T: Approximately 2.65
* At 0.3T: Approximately 2.60
* **Early-2k (Orange circles):** The line slopes downward consistently.
* At 0.0T: Approximately 2.76
* At 0.2T: Approximately 2.70
* At 0.3T: Approximately 2.66
### Key Observations
* All four configurations exhibit a decrease in Interleaved CE as time increases.
* The "Late" configurations generally have higher Interleaved CE values than the "Early" configurations at all time points.
* The "2k" configurations generally have higher Interleaved CE values than the "1k" configurations at all time points.
* The Early-1k configuration consistently shows the lowest Interleaved CE values.
### Interpretation
The data suggests that Interleaved CE degrades over time for all tested configurations. The "Late" configurations, and those with "2k" settings, demonstrate better coding efficiency compared to the "Early" and "1k" configurations, respectively. This could indicate that the "Late" and "2k" settings are more robust to the effects of time or are inherently more efficient. The consistent downward trend across all lines suggests a systematic effect, potentially related to resource exhaustion, increased complexity, or other time-dependent factors. The differences between the configurations suggest that certain parameter settings can mitigate the degradation of Interleaved CE over time. Further investigation would be needed to understand the underlying mechanisms driving these trends and to optimize the configurations for sustained coding efficiency.