## Bar Chart: Model Accuracy Comparison
### Overview
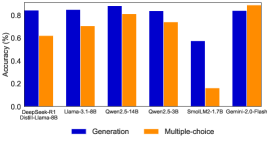
The image is a bar chart comparing the accuracy of different language models on two tasks: generation and multiple-choice. The chart displays the accuracy percentage on the y-axis and the model names on the x-axis. The legend at the bottom indicates that blue bars represent generation accuracy and orange bars represent multiple-choice accuracy.
### Components/Axes
* **Y-axis:** Accuracy (%), ranging from 0.0 to 0.8. Increments are not explicitly marked, but the scale appears linear.
* **X-axis:** Model names: DeepGeek-R1 Distill-Llama-8B, Uama-3.1-8B, Qwer2.5-14B, Qwer2.5-3B, SmolLM2-1.7B, Gemini-2.0-Flash.
* **Legend:** Located at the bottom of the chart.
* Blue: Generation
* Orange: Multiple-choice
### Detailed Analysis
Here's a breakdown of the accuracy for each model on both tasks:
* **DeepGeek-R1 Distill-Llama-8B:**
* Generation (Blue): Approximately 0.83
* Multiple-choice (Orange): Approximately 0.62
* **Uama-3.1-8B:**
* Generation (Blue): Approximately 0.84
* Multiple-choice (Orange): Approximately 0.70
* **Qwer2.5-14B:**
* Generation (Blue): Approximately 0.86
* Multiple-choice (Orange): Approximately 0.80
* **Qwer2.5-3B:**
* Generation (Blue): Approximately 0.81
* Multiple-choice (Orange): Approximately 0.74
* **SmolLM2-1.7B:**
* Generation (Blue): Approximately 0.57
* Multiple-choice (Orange): Approximately 0.16
* **Gemini-2.0-Flash:**
* Generation (Blue): Approximately 0.83
* Multiple-choice (Orange): Approximately 0.82
**Trends:**
* For all models except SmolLM2-1.7B, the generation accuracy is higher than the multiple-choice accuracy.
* SmolLM2-1.7B shows a significantly lower accuracy for both tasks compared to the other models.
* Qwer2.5-14B and Gemini-2.0-Flash have the highest multiple-choice accuracy, nearly matching their generation accuracy.
### Key Observations
* SmolLM2-1.7B is a clear outlier, performing significantly worse than the other models on both tasks.
* The other models show relatively consistent performance, with generation accuracy generally above 0.8.
* The difference between generation and multiple-choice accuracy varies across models, with some models showing a smaller gap than others.
### Interpretation
The bar chart provides a comparative analysis of the accuracy of different language models on generation and multiple-choice tasks. The data suggests that most models perform better on generation tasks than on multiple-choice tasks, except for SmolLM2-1.7B, which performs poorly on both. The performance of SmolLM2-1.7B is a notable anomaly, suggesting potential issues with its architecture, training data, or hyperparameter tuning. The relatively high and consistent performance of the other models indicates that they are reasonably well-suited for both generation and multiple-choice tasks. The chart highlights the importance of evaluating language models on multiple tasks to gain a comprehensive understanding of their capabilities and limitations.