\n
## Bar Chart: Model Accuracy Comparison (Generation vs. Multiple-choice)
### Overview
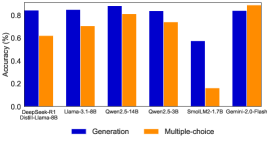
The image is a vertical bar chart comparing the accuracy percentages of various large language models on two distinct task types: "Generation" and "Multiple-choice." The chart presents a side-by-side comparison for each model, highlighting performance differences between the two evaluation paradigms.
### Components/Axes
* **Chart Title:** `Accuracy (%)` (Positioned at the top-left of the chart area).
* **Y-Axis:**
* **Label:** `Accuracy (%)` (Vertical text along the left axis).
* **Scale:** Linear scale from `0.0` to `1.0`, with major tick marks at `0.0`, `0.2`, `0.4`, `0.6`, `0.8`, and `1.0`.
* **X-Axis:**
* **Label:** None explicitly stated. The axis contains categorical labels for different models/configurations.
* **Categories (from left to right):**
1. `Qwen2.5-72B (Chat)`
2. `Llama-3.1-405B`
3. `Qwen2-72B-14B`
4. `Qwen2-7B-3B`
5. `Small-1.7B-1.7B`
6. `Qwen2-7B-Plain`
* **Legend:**
* **Position:** Centered at the bottom of the chart.
* **Items:**
* **Blue Square:** `Generation`
* **Orange Square:** `Multiple-choice`
### Detailed Analysis
The chart displays paired bars for each of the six model categories. The blue bar (Generation) is consistently positioned to the left of the orange bar (Multiple-choice) for each pair.
**Trend Verification & Data Points (Approximate Values):**
1. **Qwen2.5-72B (Chat):**
* **Generation (Blue):** The bar reaches the `1.0` line. **Trend:** Maximum value.
* **Multiple-choice (Orange):** The bar is slightly above the `0.8` line. **Approximate Value:** ~0.82.
2. **Llama-3.1-405B:**
* **Generation (Blue):** The bar is at the `1.0` line. **Trend:** Maximum value.
* **Multiple-choice (Orange):** The bar is slightly below the `0.8` line. **Approximate Value:** ~0.78.
3. **Qwen2-72B-14B:**
* **Generation (Blue):** The bar is at the `1.0` line. **Trend:** Maximum value.
* **Multiple-choice (Orange):** The bar is slightly above the `0.8` line. **Approximate Value:** ~0.82.
4. **Qwen2-7B-3B:**
* **Generation (Blue):** The bar is at the `1.0` line. **Trend:** Maximum value.
* **Multiple-choice (Orange):** The bar is slightly below the `0.8` line. **Approximate Value:** ~0.78.
5. **Small-1.7B-1.7B:**
* **Generation (Blue):** The bar is slightly below the `0.6` line. **Approximate Value:** ~0.58.
* **Multiple-choice (Orange):** The bar is slightly above the `0.8` line. **Approximate Value:** ~0.82.
6. **Qwen2-7B-Plain:**
* **Generation (Blue):** The bar is at the `1.0` line. **Trend:** Maximum value.
* **Multiple-choice (Orange):** The bar is also at the `1.0` line. **Trend:** Maximum value.
### Key Observations
1. **Performance Gap:** For the first four models listed, there is a consistent and notable performance gap. The "Generation" task accuracy is at or near the maximum (1.0 or 100%), while the "Multiple-choice" task accuracy is lower, hovering around 0.78-0.82 (78-82%).
2. **Significant Outlier:** The model labeled `Small-1.7B-1.7B` shows a complete reversal of the general trend. Its "Generation" accuracy (~0.58) is significantly lower than its "Multiple-choice" accuracy (~0.82). This is the only instance where the Multiple-choice bar is taller than the Generation bar.
3. **Perfect Parity:** The final model, `Qwen2-7B-Plain`, achieves perfect accuracy (1.0) on both task types, showing no performance gap.
4. **Scale Consistency:** The y-axis scale from 0.0 to 1.0 suggests these are normalized accuracy scores, likely representing 0% to 100%.
### Interpretation
The data suggests a fundamental difference in how these models perform on generative versus discriminative (multiple-choice) tasks. For most of the larger or chat-tuned models shown, generating correct text appears to be an easier task than selecting the correct option from a predefined set. This could indicate that the models' generative capabilities are more robust or better aligned with the evaluation metric for the "Generation" task.
The stark outlier, `Small-1.7B-1.7B`, implies that model size, architecture, or training regimen dramatically affects this balance. Its poor generative performance relative to its multiple-choice performance might point to limitations in its ability to produce coherent, correct text from scratch, even if it can recognize correct answers.
The perfect scores for `Qwen2-7B-Plain` are notable and could indicate either a very simple evaluation task for that specific model configuration or a potential ceiling effect in the benchmark used. The chart effectively communicates that model performance is not monolithic; it varies significantly based on the type of cognitive task required.