## Line Charts: Model Accuracy vs. Number of Solutions
### Overview
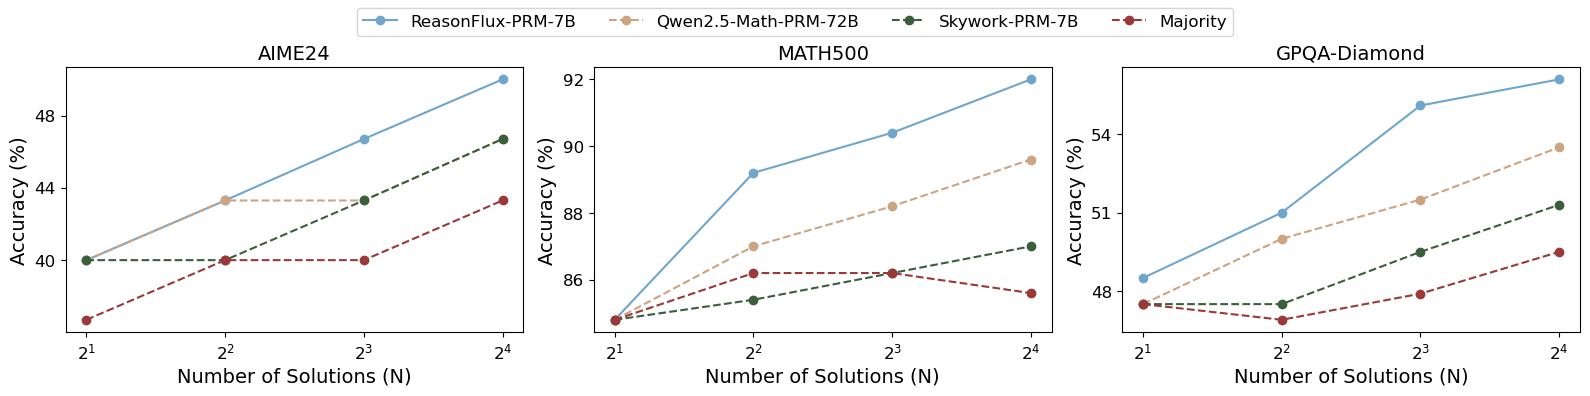
The image presents three line charts comparing the accuracy of different language models (ReasonFlux-PRM-7B, Qwen2.5-Math-PRM-72B, Skywork-PRM-7B, and Majority) on three datasets (AIME24, MATH500, and GPQA-Diamond) as the number of solutions increases. The x-axis represents the number of solutions (N) on a logarithmic scale (base 2), and the y-axis represents the accuracy in percentage.
### Components/Axes
* **Title:** The image contains three separate charts, titled "AIME24", "MATH500", and "GPQA-Diamond".
* **X-axis:**
* Label: "Number of Solutions (N)"
* Scale: Logarithmic (base 2) with markers at 2<sup>1</sup>, 2<sup>2</sup>, 2<sup>3</sup>, and 2<sup>4</sup>. These correspond to 2, 4, 8, and 16 solutions.
* **Y-axis:**
* Label: "Accuracy (%)"
* Scale: Linear.
* AIME24: Ranges from 40% to 48%
* MATH500: Ranges from 86% to 92%
* GPQA-Diamond: Ranges from 48% to 54%
* **Legend:** Located at the top of the image.
* ReasonFlux-PRM-7B: Solid light blue line.
* Qwen2.5-Math-PRM-72B: Dashed light brown line.
* Skywork-PRM-7B: Dashed dark green line.
* Majority: Dashed dark red line.
### Detailed Analysis
#### AIME24 Chart
* **ReasonFlux-PRM-7B (Light Blue):** Line slopes upward.
* 2<sup>1</sup> (2 solutions): ~40%
* 2<sup>2</sup> (4 solutions): ~44%
* 2<sup>3</sup> (8 solutions): ~47%
* 2<sup>4</sup> (16 solutions): ~49%
* **Qwen2.5-Math-PRM-72B (Light Brown):** Line slopes upward.
* 2<sup>1</sup> (2 solutions): ~40%
* 2<sup>2</sup> (4 solutions): ~44%
* 2<sup>3</sup> (8 solutions): ~45%
* 2<sup>4</sup> (16 solutions): ~46%
* **Skywork-PRM-7B (Dark Green):** Line is relatively flat.
* 2<sup>1</sup> (2 solutions): ~40%
* 2<sup>2</sup> (4 solutions): ~40%
* 2<sup>3</sup> (8 solutions): ~43%
* 2<sup>4</sup> (16 solutions): ~44%
* **Majority (Dark Red):** Line is relatively flat.
* 2<sup>1</sup> (2 solutions): ~37%
* 2<sup>2</sup> (4 solutions): ~40%
* 2<sup>3</sup> (8 solutions): ~40%
* 2<sup>4</sup> (16 solutions): ~40%
#### MATH500 Chart
* **ReasonFlux-PRM-7B (Light Blue):** Line slopes upward.
* 2<sup>1</sup> (2 solutions): ~85%
* 2<sup>2</sup> (4 solutions): ~89%
* 2<sup>3</sup> (8 solutions): ~90%
* 2<sup>4</sup> (16 solutions): ~92%
* **Qwen2.5-Math-PRM-72B (Light Brown):** Line slopes upward.
* 2<sup>1</sup> (2 solutions): ~85%
* 2<sup>2</sup> (4 solutions): ~87%
* 2<sup>3</sup> (8 solutions): ~87%
* 2<sup>4</sup> (16 solutions): ~90%
* **Skywork-PRM-7B (Dark Green):** Line is relatively flat.
* 2<sup>1</sup> (2 solutions): ~85%
* 2<sup>2</sup> (4 solutions): ~86%
* 2<sup>3</sup> (8 solutions): ~86%
* 2<sup>4</sup> (16 solutions): ~87%
* **Majority (Dark Red):** Line is relatively flat.
* 2<sup>1</sup> (2 solutions): ~85%
* 2<sup>2</sup> (4 solutions): ~86%
* 2<sup>3</sup> (8 solutions): ~86.5%
* 2<sup>4</sup> (16 solutions): ~86%
#### GPQA-Diamond Chart
* **ReasonFlux-PRM-7B (Light Blue):** Line slopes upward.
* 2<sup>1</sup> (2 solutions): ~48%
* 2<sup>2</sup> (4 solutions): ~51%
* 2<sup>3</sup> (8 solutions): ~53%
* 2<sup>4</sup> (16 solutions): ~55%
* **Qwen2.5-Math-PRM-72B (Light Brown):** Line slopes upward.
* 2<sup>1</sup> (2 solutions): ~48%
* 2<sup>2</sup> (4 solutions): ~49%
* 2<sup>3</sup> (8 solutions): ~52%
* 2<sup>4</sup> (16 solutions): ~54%
* **Skywork-PRM-7B (Dark Green):** Line is relatively flat.
* 2<sup>1</sup> (2 solutions): ~47%
* 2<sup>2</sup> (4 solutions): ~47%
* 2<sup>3</sup> (8 solutions): ~48%
* 2<sup>4</sup> (16 solutions): ~52%
* **Majority (Dark Red):** Line is relatively flat.
* 2<sup>1</sup> (2 solutions): ~47%
* 2<sup>2</sup> (4 solutions): ~48%
* 2<sup>3</sup> (8 solutions): ~49%
* 2<sup>4</sup> (16 solutions): ~50%
### Key Observations
* ReasonFlux-PRM-7B (light blue) consistently shows the highest accuracy across all three datasets as the number of solutions increases.
* Skywork-PRM-7B (dark green) generally shows the lowest accuracy and the least improvement as the number of solutions increases.
* The "Majority" model (dark red) performs similarly to Skywork-PRM-7B.
* The MATH500 dataset has the highest accuracy scores across all models, while AIME24 has the lowest.
* The performance gap between ReasonFlux-PRM-7B and the other models is most pronounced in the GPQA-Diamond dataset.
### Interpretation
The charts demonstrate the impact of increasing the number of solutions on the accuracy of different language models across various datasets. ReasonFlux-PRM-7B consistently outperforms the other models, suggesting it is more effective at leveraging multiple solutions to improve its accuracy. The relatively flat performance of Skywork-PRM-7B and the "Majority" model indicates that they are less capable of utilizing additional solutions to enhance their performance. The varying accuracy levels across the datasets suggest that the models' performance is also influenced by the specific characteristics and difficulty of each dataset. The increasing accuracy with more solutions suggests that these models benefit from having more options to choose from, potentially allowing them to correct errors or refine their answers.