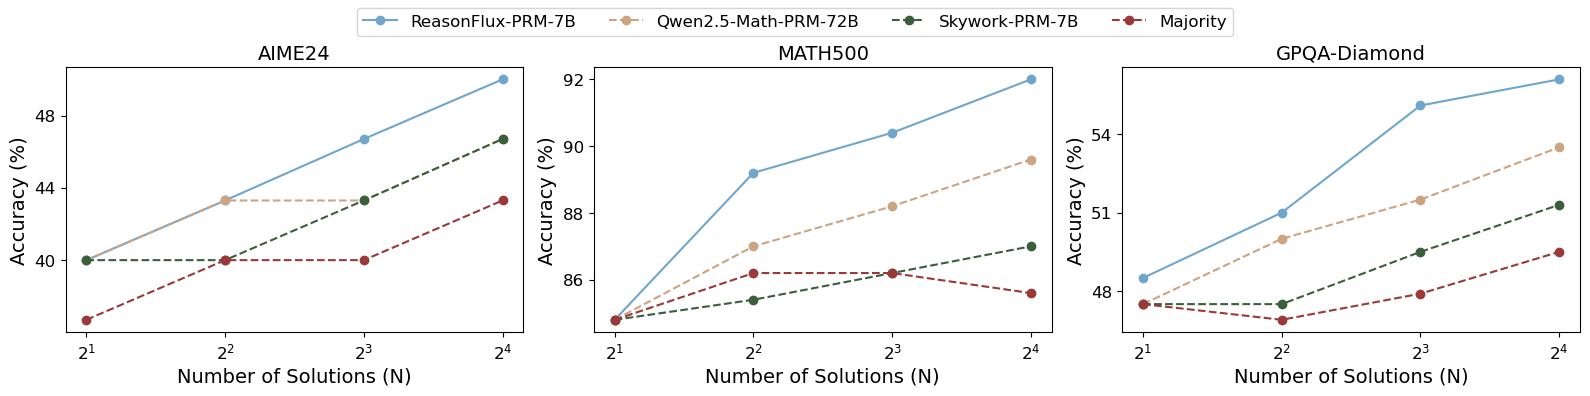
## Line Charts: Model Accuracy vs. Number of Solutions
### Overview
This image presents three separate line charts, each displaying the accuracy of different models (ReasonFlux-PRM-7B, Qwen2.5-Math-PRM-72B, Skywork-PRM-7B, and Majority) as a function of the number of solutions (N). The charts are arranged horizontally, one next to the other, and represent data for three different datasets: AIME24, MATH500, and GPQA-Diamond. The y-axis represents accuracy in percentage (%), and the x-axis represents the number of solutions (N) on a logarithmic scale (2<sup>1</sup> to 2<sup>4</sup>).
### Components/Axes
* **X-axis (all charts):** Number of Solutions (N), ranging from 2<sup>1</sup> (2) to 2<sup>4</sup> (16).
* **Y-axis (all charts):** Accuracy (%), ranging from approximately 46% to 94%.
* **Legend (top-left, spanning all charts):**
* ReasonFlux-PRM-7B (Blue line with diamond markers)
* Qwen2.5-Math-PRM-72B (Green line with circle markers)
* Skywork-PRM-7B (Brown line with square markers)
* Majority (Red dashed line with triangle markers)
* **Chart Titles (top-center of each chart):**
* AIME24
* MATH500
* GPQA-Diamond
### Detailed Analysis or Content Details
**AIME24 Chart:**
* **ReasonFlux-PRM-7B (Blue):** The line slopes upward, starting at approximately 46% accuracy at N=2 and reaching approximately 52% at N=16.
* N=2: ~46%
* N=4: ~48%
* N=8: ~50%
* N=16: ~52%
* **Qwen2.5-Math-PRM-72B (Green):** The line is relatively flat, starting at approximately 47% accuracy at N=2 and ending at approximately 48% at N=16.
* N=2: ~47%
* N=4: ~47%
* N=8: ~47%
* N=16: ~48%
* **Skywork-PRM-7B (Brown):** The line slopes upward, starting at approximately 46% accuracy at N=2 and reaching approximately 49% at N=16.
* N=2: ~46%
* N=4: ~47%
* N=8: ~48%
* N=16: ~49%
* **Majority (Red):** The line slopes upward, starting at approximately 40% accuracy at N=2 and reaching approximately 44% at N=16.
* N=2: ~40%
* N=4: ~42%
* N=8: ~43%
* N=16: ~44%
**MATH500 Chart:**
* **ReasonFlux-PRM-7B (Blue):** The line slopes sharply upward, starting at approximately 84% accuracy at N=2 and reaching approximately 93% at N=16.
* N=2: ~84%
* N=4: ~88%
* N=8: ~91%
* N=16: ~93%
* **Qwen2.5-Math-PRM-72B (Green):** The line slopes upward, starting at approximately 83% accuracy at N=2 and reaching approximately 87% at N=16.
* N=2: ~83%
* N=4: ~85%
* N=8: ~86%
* N=16: ~87%
* **Skywork-PRM-7B (Brown):** The line slopes upward, starting at approximately 82% accuracy at N=2 and reaching approximately 86% at N=16.
* N=2: ~82%
* N=4: ~84%
* N=8: ~85%
* N=16: ~86%
* **Majority (Red):** The line slopes downward, starting at approximately 86% accuracy at N=2 and reaching approximately 84% at N=16.
* N=2: ~86%
* N=4: ~85%
* N=8: ~85%
* N=16: ~84%
**GPQA-Diamond Chart:**
* **ReasonFlux-PRM-7B (Blue):** The line slopes upward, starting at approximately 47% accuracy at N=2 and reaching approximately 54% at N=16.
* N=2: ~47%
* N=4: ~49%
* N=8: ~51%
* N=16: ~54%
* **Qwen2.5-Math-PRM-72B (Green):** The line slopes upward, starting at approximately 47% accuracy at N=2 and reaching approximately 49% at N=16.
* N=2: ~47%
* N=4: ~48%
* N=8: ~48%
* N=16: ~49%
* **Skywork-PRM-7B (Brown):** The line is relatively flat, starting at approximately 48% accuracy at N=2 and ending at approximately 50% at N=16.
* N=2: ~48%
* N=4: ~49%
* N=8: ~49%
* N=16: ~50%
* **Majority (Red):** The line is relatively flat, starting at approximately 48% accuracy at N=2 and ending at approximately 48% at N=16.
* N=2: ~48%
* N=4: ~48%
* N=8: ~48%
* N=16: ~48%
### Key Observations
* **MATH500** shows the highest overall accuracy across all models.
* **ReasonFlux-PRM-7B** consistently performs well, particularly on MATH500 and GPQA-Diamond, showing a positive correlation between accuracy and the number of solutions.
* The **Majority** model generally exhibits the lowest accuracy, and in the MATH500 dataset, its accuracy *decreases* with an increasing number of solutions.
* The accuracy gains from increasing the number of solutions appear to diminish for some models (e.g., Qwen2.5-Math-PRM-72B on AIME24).
### Interpretation
The charts demonstrate the performance of different language models on three distinct mathematical reasoning datasets as the complexity of the problem (represented by the number of solutions) increases. The significant performance difference across datasets suggests that the models' strengths and weaknesses are dataset-dependent. The positive correlation between accuracy and the number of solutions for ReasonFlux-PRM-7B on MATH500 and GPQA-Diamond indicates that this model benefits from more computational resources or a more thorough search process. The decreasing accuracy of the Majority model on MATH500 is a notable anomaly, potentially indicating that the majority vote approach is less effective for more complex problems. The relatively flat performance of Qwen2.5-Math-PRM-72B and Skywork-PRM-7B on AIME24 suggests they may have reached a performance plateau for this dataset, or that the benefit of increasing the number of solutions is minimal. These results provide valuable insights into the capabilities and limitations of each model and highlight the importance of selecting the appropriate model for a given task and dataset.