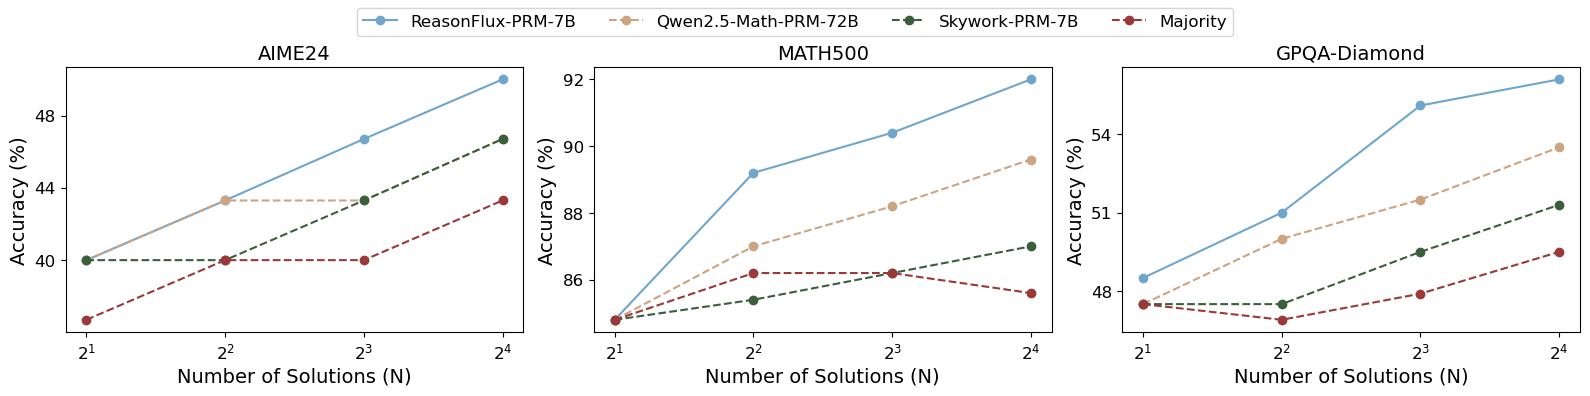
## Line Charts: Accuracy vs. Number of Solutions (N) for Three Datasets (AIME24, MATH500, GPQA-Diamond)
### Overview
The image contains three line charts (subplots) sharing a common legend, illustrating the relationship between the number of solutions ( \( N \), on a logarithmic scale: \( 2^1, 2^2, 2^3, 2^4 \)) and accuracy (in percentage) for four models/approaches: *ReasonFlux-PRM-7B*, *Qwen2.5-Math-PRM-72B*, *Skywork-PRM-7B*, and *Majority*. The subplots correspond to three datasets: **AIME24** (left), **MATH500** (middle), and **GPQA-Diamond** (right).
### Components/Axes
- **Legend (Top Center)**: Four series (color-coded):
- *ReasonFlux-PRM-7B*: Blue solid line
- *Qwen2.5-Math-PRM-72B*: Beige dashed line
- *Skywork-PRM-7B*: Green dashed line
- *Majority*: Red dashed line
- **X-axis (All Subplots)**: *“Number of Solutions (N)”* with ticks at \( 2^1 \) (2), \( 2^2 \) (4), \( 2^3 \) (8), \( 2^4 \) (16) (logarithmic scale).
- **Y-axis (All Subplots)**: *“Accuracy (%)”* with dataset-specific ranges:
- AIME24: ~38–48% (ticks: 40, 44, 48)
- MATH500: ~85–92% (ticks: 86, 88, 90, 92)
- GPQA-Diamond: ~47–55% (ticks: 48, 51, 54)
### Detailed Analysis (Per Subplot)
#### 1. AIME24 (Left Subplot)
- **ReasonFlux-PRM-7B (Blue)**:
- \( N=2^1 \): ~40%
- \( N=2^2 \): ~43%
- \( N=2^3 \): ~46%
- \( N=2^4 \): ~48% (steepest upward trend)
- **Qwen2.5-Math-PRM-72B (Beige)**:
- \( N=2^1 \): ~40%
- \( N=2^2 \): ~43%
- \( N=2^3 \): ~43%
- \( N=2^4 \): ~43% (plateaus after \( N=4 \))
- **Skywork-PRM-7B (Green)**:
- \( N=2^1 \): ~40%
- \( N=2^2 \): ~40%
- \( N=2^3 \): ~43%
- \( N=2^4 \): ~46% (gradual upward trend)
- **Majority (Red)**:
- \( N=2^1 \): ~38%
- \( N=2^2 \): ~40%
- \( N=2^3 \): ~40%
- \( N=2^4 \): ~43% (slow upward trend)
#### 2. MATH500 (Middle Subplot)
- **ReasonFlux-PRM-7B (Blue)**:
- \( N=2^1 \): ~85%
- \( N=2^2 \): ~89%
- \( N=2^3 \): ~90%
- \( N=2^4 \): ~92% (steepest upward trend)
- **Qwen2.5-Math-PRM-72B (Beige)**:
- \( N=2^1 \): ~85%
- \( N=2^2 \): ~87%
- \( N=2^3 \): ~88%
- \( N=2^4 \): ~89% (gradual upward trend)
- **Skywork-PRM-7B (Green)**:
- \( N=2^1 \): ~85%
- \( N=2^2 \): ~85%
- \( N=2^3 \): ~86%
- \( N=2^4 \): ~87% (slow upward trend)
- **Majority (Red)**:
- \( N=2^1 \): ~85%
- \( N=2^2 \): ~86%
- \( N=2^3 \): ~86%
- \( N=2^4 \): ~85% (slight drop at \( N=16 \))
#### 3. GPQA-Diamond (Right Subplot)
- **ReasonFlux-PRM-7B (Blue)**:
- \( N=2^1 \): ~48%
- \( N=2^2 \): ~51%
- \( N=2^3 \): ~54%
- \( N=2^4 \): ~55% (steepest upward trend)
- **Qwen2.5-Math-PRM-72B (Beige)**:
- \( N=2^1 \): ~48%
- \( N=2^2 \): ~50%
- \( N=2^3 \): ~52%
- \( N=2^4 \): ~54% (gradual upward trend)
- **Skywork-PRM-7B (Green)**:
- \( N=2^1 \): ~48%
- \( N=2^2 \): ~48%
- \( N=2^3 \): ~50%
- \( N=2^4 \): ~52% (slow upward trend)
- **Majority (Red)**:
- \( N=2^1 \): ~48%
- \( N=2^2 \): ~47% (drop)
- \( N=2^3 \): ~48%
- \( N=2^4 \): ~50% (recovery and upward trend)
### Key Observations
- **Trend Consistency**: *ReasonFlux-PRM-7B* (blue) consistently shows the steepest upward trend in accuracy with increasing \( N \) across all three datasets.
- **Plateauing/Decline**: *Qwen2.5-Math-PRM-72B* (beige) plateaus in AIME24 after \( N=4 \), while *Majority* (red) shows a slight decline in MATH500 at \( N=16 \) and a drop in GPQA-Diamond at \( N=2 \).
- **Dataset Differences**: MATH500 has the highest overall accuracy (85–92%), while AIME24 and GPQA-Diamond have lower ranges (38–48% and 47–55%, respectively), suggesting varying difficulty or model performance across datasets.
### Interpretation
The charts demonstrate that increasing the number of solutions (\( N \)) generally improves accuracy for most models, with *ReasonFlux-PRM-7B* benefiting the most (steepest slope). This suggests that more solutions (or a larger ensemble) enhance performance, especially for *ReasonFlux*. The plateau in *Qwen2.5-Math-PRM-72B* (AIME24) and decline in *Majority* (MATH500, GPQA-Diamond) may indicate diminishing returns or model-specific limitations with larger \( N \). The dataset-specific accuracy ranges imply that MATH500 is more “solvable” (higher baseline accuracy) than AIME24 and GPQA-Diamond, or that the models are better optimized for MATH500. Overall, the data supports the hypothesis that increasing solution count boosts accuracy, with model-specific and dataset-specific variations in the magnitude of improvement.