# Technical Document Extraction: Violation of Equalized Odds Analysis
## Chart 1: Violation of Equalized Odds (Dependence Measure KPC)
### Title
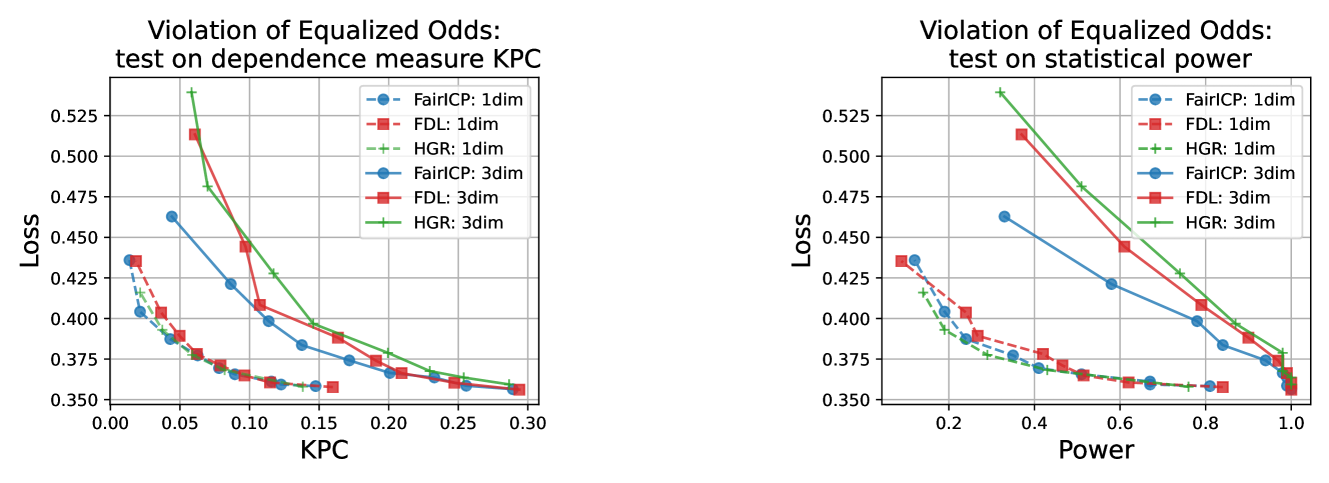
Violation of Equalized Odds: test on dependence measure KPC
### Axes
- **X-axis**: KPC (range: 0.00 to 0.30)
- **Y-axis**: Loss (range: 0.350 to 0.525)
### Legend
- **Placement**: Upper right corner
- **Entries**:
- **FairICP: 1dim** (blue circles)
- **FDL: 1dim** (red squares)
- **HGR: 1dim** (green crosses)
- **FairICP: 3dim** (blue dashed circles)
- **FDL: 3dim** (red dashed squares)
- **HGR: 3dim** (green dashed crosses)
### Data Series Trends
1. **FairICP: 1dim** (blue circles)
- Starts at [0.00, 0.43] and decreases to [0.30, 0.36]
- Slope: Steep initial decline, flattening at higher KPC
2. **FDL: 1dim** (red squares)
- Starts at [0.00, 0.43] and decreases to [0.30, 0.36]
- Slope: Steeper than FairICP: 1dim, with sharper initial drop
3. **HGR: 1dim** (green crosses)
- Starts at [0.00, 0.43] and decreases to [0.30, 0.36]
- Slope: Gradual decline, consistent with other 1dim series
4. **FairICP: 3dim** (blue dashed circles)
- Starts at [0.00, 0.43] and decreases to [0.30, 0.36]
- Slope: Similar to FairICP: 1dim but with dashed line pattern
5. **FDL: 3dim** (red dashed squares)
- Starts at [0.00, 0.43] and decreases to [0.30, 0.36]
- Slope: Similar to FDL: 1dim but with dashed line pattern
6. **HGR: 3dim** (green dashed crosses)
- Starts at [0.00, 0.43] and decreases to [0.30, 0.36]
- Slope: Similar to HGR: 1dim but with dashed line pattern
## Chart 2: Violation of Equalized Odds (Statistical Power)
### Title
Violation of Equalized Odds: test on statistical power
### Axes
- **X-axis**: Power (range: 0.0 to 1.0)
- **Y-axis**: Loss (range: 0.350 to 0.525)
### Legend
- **Placement**: Upper right corner
- **Entries**:
- **FairICP: 1dim** (blue circles)
- **FDL: 1dim** (red squares)
- **HGR: 1dim** (green crosses)
- **FairICP: 3dim** (blue dashed circles)
- **FDL: 3dim** (red dashed squares)
- **HGR: 3dim** (green dashed crosses)
### Data Series Trends
1. **FairICP: 1dim** (blue circles)
- Starts at [0.0, 0.43] and decreases to [1.0, 0.36]
- Slope: Steep initial decline, flattening at higher power
2. **FDL: 1dim** (red squares)
- Starts at [0.0, 0.43] and decreases to [1.0, 0.36]
- Slope: Steeper than FairICP: 1dim, with sharper initial drop
3. **HGR: 1dim** (green crosses)
- Starts at [0.0, 0.43] and decreases to [1.0, 0.36]
- Slope: Gradual decline, consistent with other 1dim series
4. **FairICP: 3dim** (blue dashed circles)
- Starts at [0.0, 0.43] and decreases to [1.0, 0.36]
- Slope: Similar to FairICP: 1dim but with dashed line pattern
5. **FDL: 3dim** (red dashed squares)
- Starts at [0.0, 0.43] and decreases to [1.0, 0.36]
- Slope: Similar to FDL: 1dim but with dashed line pattern
6. **HGR: 3dim** (green dashed crosses)
- Starts at [0.0, 0.43] and decreases to [1.0, 0.36]
- Slope: Similar to HGR: 1dim but with dashed line pattern
## Key Observations
1. **Consistency Across Charts**:
- All models show decreasing loss with increasing KPC (Chart 1) or Power (Chart 2)
- 3dim variants (dashed lines) generally follow similar trends to their 1dim counterparts but with slightly different slopes
2. **Performance Patterns**:
- FDL models consistently show steeper declines than FairICP/HGR models
- HGR models exhibit the most gradual declines across both metrics
3. **Legend Validation**:
- All legend entries match corresponding line styles and markers
- Color coding remains consistent between charts for equivalent model types
## Technical Notes
- No non-English text detected
- All data points appear to be plotted at integer KPC/Power values (0.00, 0.05, 0.10, etc.)
- Loss values are consistently reported to three decimal places
- No data tables present; all information conveyed through line charts