## Line Chart: Test Time Search Performance on MATH500
### Overview
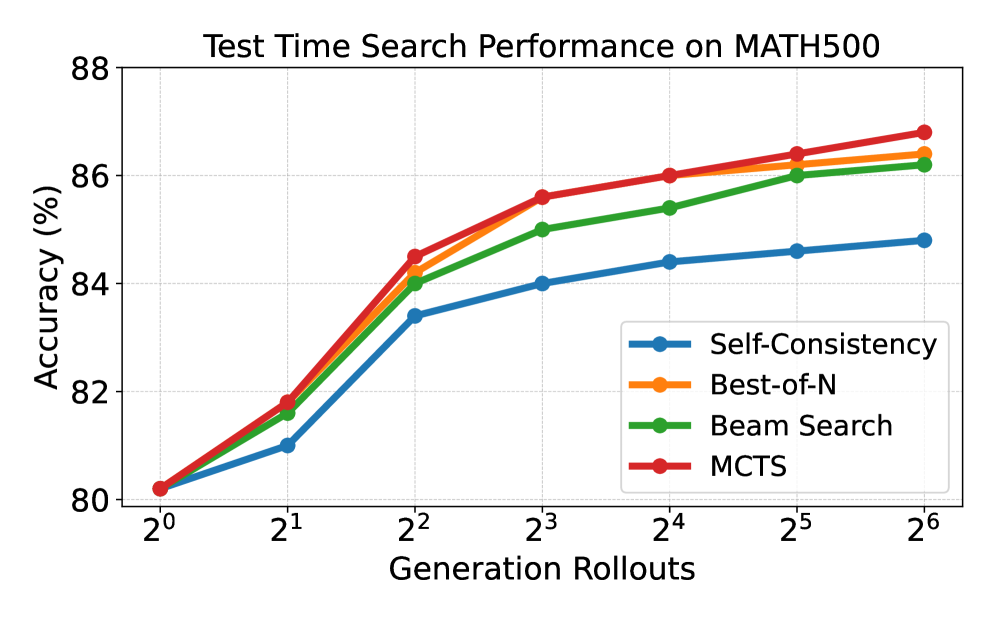
This is a line chart comparing the performance of four different search strategies on the MATH500 benchmark. The chart plots accuracy percentage against the number of generation rollouts, which is presented on a logarithmic scale (base 2). All four strategies show improved accuracy as the number of rollouts increases, with performance gains beginning to plateau after approximately 8 (2³) rollouts.
### Components/Axes
* **Chart Title:** "Test Time Search Performance on MATH500"
* **Y-Axis:**
* **Label:** "Accuracy (%)"
* **Scale:** Linear, ranging from 80 to 88, with major tick marks every 2 units (80, 82, 84, 86, 88).
* **X-Axis:**
* **Label:** "Generation Rollouts"
* **Scale:** Logarithmic (base 2), with markers at 2⁰ (1), 2¹ (2), 2² (4), 2³ (8), 2⁴ (16), 2⁵ (32), and 2⁶ (64).
* **Legend:** Located in the bottom-right quadrant of the chart area. It contains four entries, each with a colored line, a marker symbol, and a text label.
1. **Blue line with circle markers:** "Self-Consistency"
2. **Orange line with circle markers:** "Best-of-N"
3. **Green line with circle markers:** "Beam Search"
4. **Red line with circle markers:** "MCTS"
### Detailed Analysis
The chart displays four data series, each representing a search strategy. All lines originate from the same approximate starting point at 2⁰ rollouts and trend upward with a diminishing rate of increase.
**Trend Verification:** All four lines slope upward from left to right, indicating that accuracy improves with more generation rollouts. The rate of improvement is steepest between 2⁰ and 2³ rollouts and becomes more gradual thereafter.
**Data Point Extraction (Approximate Values):**
* **At 2⁰ (1 rollout):** All four strategies start at approximately **80.2%** accuracy.
* **At 2¹ (2 rollouts):**
* MCTS (Red): ~81.8%
* Best-of-N (Orange): ~81.7%
* Beam Search (Green): ~81.6%
* Self-Consistency (Blue): ~81.0%
* **At 2² (4 rollouts):**
* MCTS (Red): ~84.5%
* Best-of-N (Orange): ~84.3%
* Beam Search (Green): ~84.0%
* Self-Consistency (Blue): ~83.4%
* **At 2³ (8 rollouts):**
* MCTS (Red): ~85.6%
* Best-of-N (Orange): ~85.5%
* Beam Search (Green): ~85.0%
* Self-Consistency (Blue): ~84.0%
* **At 2⁴ (16 rollouts):**
* MCTS (Red): ~86.0%
* Best-of-N (Orange): ~85.9%
* Beam Search (Green): ~85.4%
* Self-Consistency (Blue): ~84.4%
* **At 2⁵ (32 rollouts):**
* MCTS (Red): ~86.4%
* Best-of-N (Orange): ~86.3%
* Beam Search (Green): ~86.0%
* Self-Consistency (Blue): ~84.6%
* **At 2⁶ (64 rollouts):**
* MCTS (Red): ~86.8%
* Best-of-N (Orange): ~86.4%
* Beam Search (Green): ~86.2%
* Self-Consistency (Blue): ~84.8%
### Key Observations
1. **Performance Hierarchy:** A consistent ranking is maintained across all rollout counts greater than 1. From highest to lowest accuracy: **MCTS > Best-of-N > Beam Search > Self-Consistency**.
2. **Diminishing Returns:** The most significant accuracy gains for all methods occur within the first 8 (2³) rollouts. After this point, the curves flatten, indicating that additional rollouts yield progressively smaller improvements.
3. **Convergence of Top Methods:** The performance gap between MCTS (red) and Best-of-N (orange) is very small, especially at higher rollout counts. They are nearly indistinguishable at 2³ and 2⁴ rollouts.
4. **Self-Consistency Lag:** The Self-Consistency method (blue) consistently underperforms the other three strategies by a margin of approximately 1.5-2.0 percentage points at higher rollout counts (2⁴ and above).
### Interpretation
This chart demonstrates the effectiveness of different test-time compute strategies for improving mathematical reasoning performance. The data suggests that:
* **Allocating more compute (rollouts) improves accuracy**, but with clear diminishing returns. The "sweet spot" for efficiency appears to be around 8-16 rollouts, after which the cost of additional compute may not justify the marginal accuracy gain.
* **Monte Carlo Tree Search (MCTS) is the most effective strategy** among those compared, consistently achieving the highest accuracy. This implies that its method of exploring and evaluating multiple reasoning paths is superior for this task.
* **Best-of-N and Beam Search are highly competitive** and perform nearly as well as MCTS, especially when given sufficient rollouts. They represent strong, potentially less complex alternatives.
* **Self-Consistency, while beneficial, is the least effective** of the four methods shown. This indicates that simply aggregating multiple independent samples (its likely mechanism) is less powerful than the more structured search employed by the other techniques.
The chart provides a clear empirical comparison for researchers or engineers selecting a search strategy for language models on mathematical tasks, highlighting the trade-off between computational cost (rollouts) and performance (accuracy).