## Line Graph: NMSEvs Frequency (200-1400 Hz)
### Overview
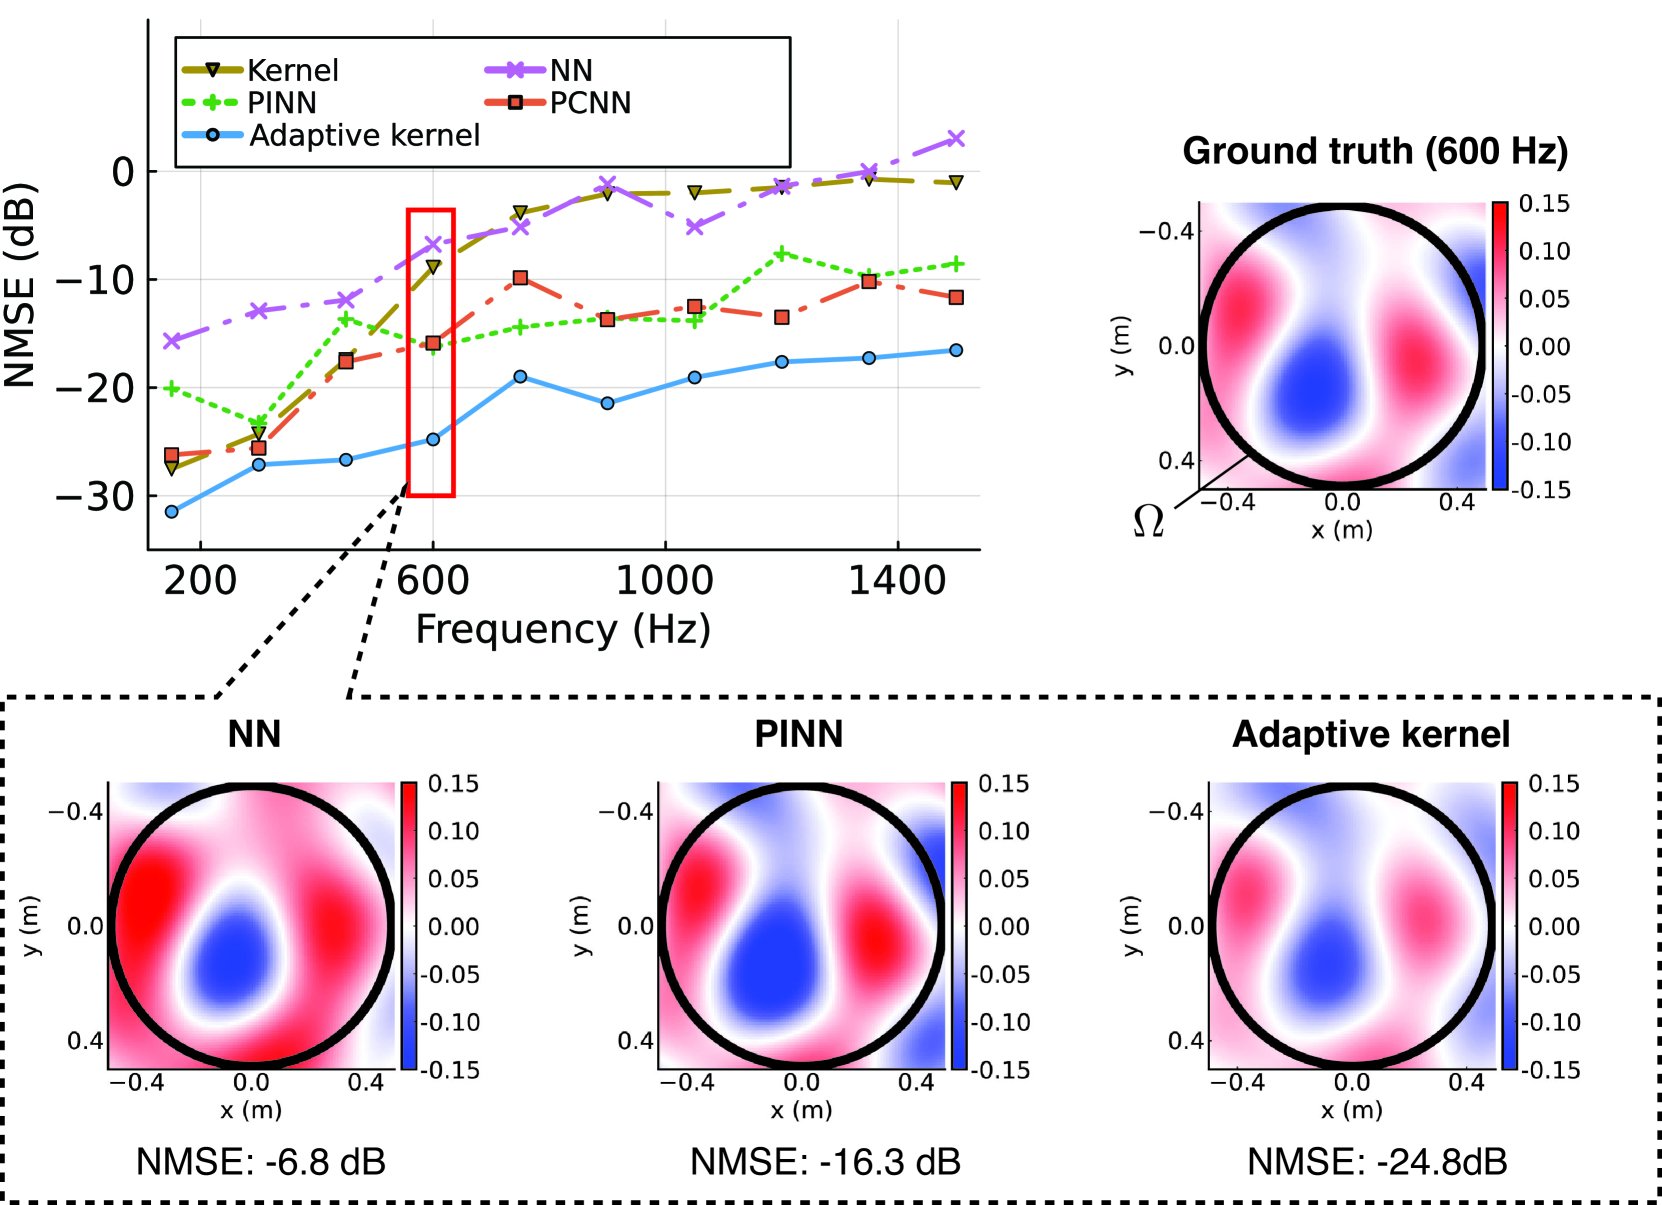
A line graph comparing Normalized Mean Squared Error (NMSE) in decibels (dB) across frequencies (200–1400 Hz) for five methods: Kernel, PINN, PCNN, NN, and Adaptive kernel. Three heatmaps below the graph show spatial error distributions for NN, PINN, and Adaptive kernel at 600 Hz.
### Components/Axes
- **X-axis (Frequency)**: 200 Hz to 1400 Hz, labeled "Frequency (Hz)".
- **Y-axis (NMSE)**: -30 dB to 0 dB, labeled "NMSE (dB)".
- **Legend**:
- Kernel: Solid brown line with triangle markers.
- PINN: Dashed green line with plus markers.
- PCNN: Solid red line with square markers.
- NN: Dashed purple line with cross markers.
- Adaptive kernel: Solid blue line with circle markers.
- **Heatmap Labels**:
- Ground truth (600 Hz): Color scale from -0.15 to 0.15.
- NN: NMSE = -6.8 dB.
- PINN: NMSE = -16.3 dB.
- Adaptive kernel: NMSE = -24.8 dB.
### Detailed Analysis
1. **Line Graph Trends**:
- **Kernel (brown)**: Starts at ~-30 dB (200 Hz), rises to ~-10 dB (1400 Hz).
- **PINN (green)**: Starts at ~-25 dB (200 Hz), fluctuates between -15 dB and -20 dB.
- **PCNN (red)**: Starts at ~-28 dB (200 Hz), peaks at ~-10 dB (600 Hz), then drops to ~-15 dB (1400 Hz).
- **NN (purple)**: Starts at ~-25 dB (200 Hz), rises to ~-10 dB (1400 Hz).
- **Adaptive kernel (blue)**: Starts at ~-30 dB (200 Hz), rises slightly to ~-20 dB (1400 Hz).
- **Red box**: Highlights 600 Hz frequency, where Kernel and NN show significant NMSE spikes.
2. **Heatmaps**:
- **Ground truth (600 Hz)**: Symmetric red/blue pattern with a central dark blue region.
- **NN**: Similar pattern to ground truth but with less defined edges (NMSE = -6.8 dB).
- **PINN**: More diffuse red/blue regions, indicating higher error (NMSE = -16.3 dB).
- **Adaptive kernel**: Closest match to ground truth, with sharp boundaries and minimal error (NMSE = -24.8 dB).
### Key Observations
- **Adaptive kernel** consistently outperforms other methods across all frequencies, with the lowest NMSE.
- **Kernel** and **NN** exhibit the highest NMSE, particularly at 600 Hz (highlighted by the red box).
- **PINN** shows moderate performance, with NMSE values between Kernel/NN and Adaptive kernel.
- Heatmaps confirm spatial error patterns: Adaptive kernel’s error distribution aligns most closely with ground truth.
### Interpretation
The data demonstrates that the **Adaptive kernel** method achieves the highest accuracy (lowest NMSE) across frequencies, particularly at 600 Hz. Its heatmap’s sharp boundaries and minimal error suggest superior performance in capturing the ground truth’s spatial distribution. In contrast, **Kernel** and **NN** methods struggle with higher errors, likely due to overfitting or insufficient adaptability. **PINN** offers a middle ground, balancing error reduction and spatial fidelity. The red box at 600 Hz emphasizes a critical frequency where method performance diverges significantly, highlighting the importance of adaptive techniques in high-frequency regimes.