TECHNICAL ASSET FINGERPRINT
254eea9c31cc983e25db616d
Click to view fullscreen
Press ESC or click to close
FOUND IN PAPERS
EXPERT: gemini-2.0-flash VERSION 1
RUNTIME: nugit/gemini/gemini-2.0-flash
INTEL_VERIFIED
## Horizontal Bar Chart: Task Difficulty Assessment
### Overview
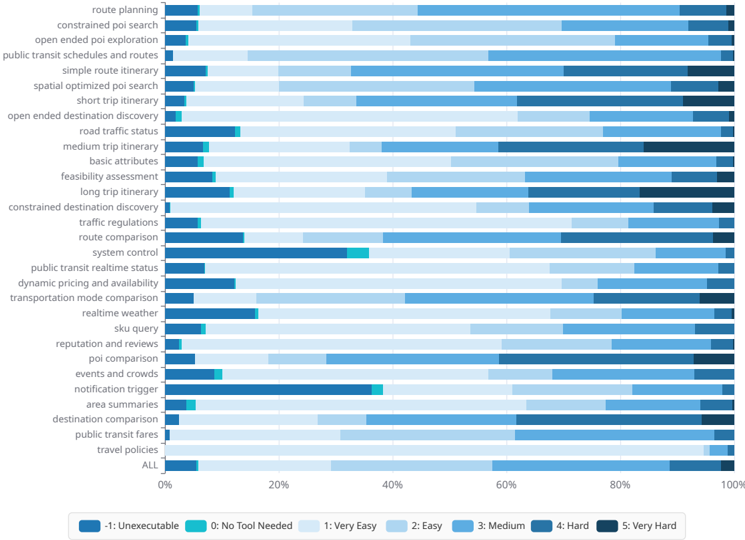
The image is a horizontal bar chart displaying the perceived difficulty of various tasks related to travel planning and information retrieval. The chart uses a color-coded scale to represent difficulty levels, ranging from "Unexecutable" to "Very Hard." Each task is listed on the vertical axis, and the horizontal axis represents the percentage distribution of responses for each difficulty level.
### Components/Axes
* **Vertical Axis (Tasks):** Lists various tasks related to travel planning and information retrieval.
* route planning
* constrained poi search
* open ended poi exploration
* public transit schedules and routes
* simple route itinerary
* spatial optimized poi search
* short trip itinerary
* open ended destination discovery
* road traffic status
* medium trip itinerary
* basic attributes
* feasibility assessment
* long trip itinerary
* constrained destination discovery
* traffic regulations
* route comparison
* system control
* public transit realtime status
* dynamic pricing and availability
* transportation mode comparison
* realtime weather
* sku query
* reputation and reviews
* poi comparison
* events and crowds
* notification trigger
* area summaries
* destination comparison
* public transit fares
* travel policies
* ALL
* **Horizontal Axis (Percentage):** Represents the percentage distribution of responses, ranging from 0% to 100%.
* Axis markers are present at 0%, 20%, 40%, 60%, 80%, and 100%.
* **Legend (Difficulty Levels):** Located at the bottom of the chart.
* -1: Unexecutable (Dark Blue)
* 0: No Tool Needed (Teal)
* 1: Very Easy (Light Blue)
* 2: Easy (Lighter Blue)
* 3: Medium (Medium Blue)
* 4: Hard (Darker Blue)
* 5: Very Hard (Darkest Blue)
### Detailed Analysis
Each task has a horizontal bar composed of different colored segments, each representing the percentage of responses for a particular difficulty level.
* **route planning:** Approximately 10% Unexecutable, 10% Very Hard, with the remaining split between Medium and Hard.
* **constrained poi search:** Approximately 10% Unexecutable, with the remaining split between Medium, Hard and Very Hard.
* **open ended poi exploration:** Mostly Medium, Hard and Very Hard.
* **public transit schedules and routes:** Mostly Easy and Medium.
* **simple route itinerary:** Mostly Very Easy and Easy.
* **spatial optimized poi search:** Mostly Medium, Hard and Very Hard.
* **short trip itinerary:** Mostly Very Easy and Easy.
* **open ended destination discovery:** Mostly Medium, Hard and Very Hard.
* **road traffic status:** Mostly Very Easy and Easy.
* **medium trip itinerary:** Mostly Very Easy and Easy.
* **basic attributes:** Mostly Very Easy and Easy.
* **feasibility assessment:** Mostly Medium, Hard and Very Hard.
* **long trip itinerary:** Mostly Medium, Hard and Very Hard.
* **constrained destination discovery:** Mostly Medium, Hard and Very Hard.
* **traffic regulations:** Mostly Medium, Hard and Very Hard.
* **route comparison:** Approximately 20% Unexecutable, with the remaining split between Medium, Hard and Very Hard.
* **system control:** Approximately 10% No Tool Needed, with the remaining split between Medium, Hard and Very Hard.
* **public transit realtime status:** Approximately 20% Unexecutable, with the remaining split between Medium, Hard and Very Hard.
* **dynamic pricing and availability:** Mostly Medium, Hard and Very Hard.
* **transportation mode comparison:** Mostly Medium, Hard and Very Hard.
* **realtime weather:** Mostly Very Easy and Easy.
* **sku query:** Approximately 10% No Tool Needed, with the remaining split between Medium, Hard and Very Hard.
* **reputation and reviews:** Mostly Medium, Hard and Very Hard.
* **poi comparison:** Mostly Medium, Hard and Very Hard.
* **events and crowds:** Approximately 10% No Tool Needed, with the remaining split between Medium, Hard and Very Hard.
* **notification trigger:** Approximately 10% No Tool Needed, with the remaining split between Medium, Hard and Very Hard.
* **area summaries:** Approximately 10% No Tool Needed, with the remaining split between Medium, Hard and Very Hard.
* **destination comparison:** Mostly Medium, Hard and Very Hard.
* **public transit fares:** Mostly Very Easy and Easy.
* **travel policies:** Mostly Medium, Hard and Very Hard.
* **ALL:** Mostly Very Easy and Easy.
### Key Observations
* Tasks like "route planning," "constrained poi search," "route comparison," and "public transit realtime status" have a significant percentage of responses indicating they are "Unexecutable."
* Tasks like "road traffic status," "medium trip itinerary," "basic attributes," "realtime weather," and "public transit fares" are generally perceived as "Very Easy" or "Easy."
* Many tasks, such as "open ended poi exploration," "spatial optimized poi search," "open ended destination discovery," "feasibility assessment," "long trip itinerary," "constrained destination discovery," "traffic regulations," "dynamic pricing and availability," "transportation mode comparison," "reputation and reviews," "poi comparison," "destination comparison," and "travel policies" are perceived as "Medium," "Hard," or "Very Hard."
* The "ALL" category shows a distribution skewed towards "Very Easy" and "Easy," suggesting that, on average, the tasks are not perceived as overly difficult.
### Interpretation
The chart provides insights into the perceived difficulty of various tasks related to travel planning and information retrieval. The high percentage of "Unexecutable" responses for certain tasks suggests potential limitations in current tools or data availability. Tasks perceived as "Very Easy" or "Easy" likely benefit from well-established tools and readily available information. The prevalence of "Medium," "Hard," and "Very Hard" ratings for many tasks indicates areas where improvements in tools, data, or user interfaces could significantly enhance the user experience. The "ALL" category suggests that, overall, the tasks are not considered extremely difficult, but there is still room for improvement in specific areas.
DECODING INTELLIGENCE...