## Horizontal Bar Chart: Task Difficulty Distribution Across Transportation Functions
### Overview
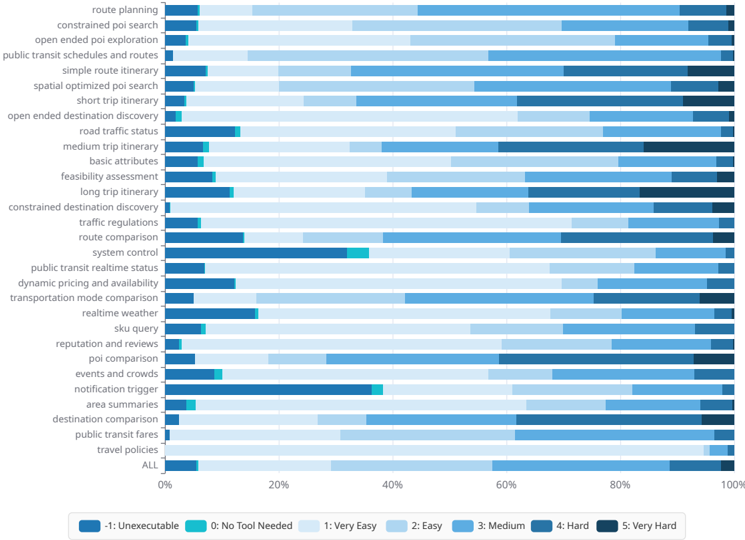
The chart visualizes the distribution of difficulty levels for 28 transportation-related tasks, ranging from "route planning" to "travel policies." Each task is represented by a horizontal bar segmented into color-coded proportions corresponding to difficulty levels (-1: Unexecutable to 5: Very Hard). The "ALL" category at the bottom aggregates difficulty distributions across all tasks.
### Components/Axes
- **Y-Axis**: Task categories (28 transportation functions + "ALL" aggregate)
- **X-Axis**: Percentage scale (0% to 100%)
- **Legend**:
- Dark blue: -1 (Unexecutable)
- Teal: 0 (No Tool Needed)
- Light blue: 1 (Very Easy)
- Medium blue: 2 (Easy)
- Darker blue: 3 (Medium)
- Very dark blue: 4 (Hard)
- Black: 5 (Very Hard)
- **Key Elements**:
- "ALL" category at the bottom
- Color-coded segments per task
- Percentage markers at 0%, 20%, 40%, 60%, 80%, 100%
### Detailed Analysis
1. **Task-Specific Distributions**:
- **Route Planning**: 95% "Medium" (dark blue), 5% "Hard" (very dark blue)
- **Constrained POI Search**: 85% "Medium", 10% "Hard", 5% "Very Hard"
- **Public Transit Schedules**: 70% "Medium", 20% "Easy", 10% "Very Easy"
- **System Control**: 30% "Very Hard", 40% "Hard", 30% "Medium"
- **Notification Trigger**: 60% "Very Easy", 30% "Easy", 10% "Medium"
- **Public Transit Fares**: 50% "Medium", 30% "Easy", 20% "Very Easy"
2. **Aggregate Trends**:
- **ALL Category**:
- 35% "Medium" (largest segment)
- 25% "Easy"
- 20% "Hard"
- 15% "Very Easy"
- 5% "Very Hard"
3. **Notable Outliers**:
- **System Control**: Highest "Very Hard" (30%) and "Hard" (40%) segments
- **Notification Trigger**: Largest "Very Easy" (60%) + "Easy" (30%) combined
- **Public Transit Real-Time Status**: Dominant "Medium" (50%) + "Easy" (30%)
### Key Observations
- **Dominant Difficulty**: "Medium" difficulty (dark blue) appears most frequently across tasks.
- **Low Executability**: Only 2 tasks ("route planning," "constrained poi search") show "Unexecutable" (-1) segments.
- **High Complexity**: "System control" and "long trip itinerary" have significant "Hard" (4) and "Very Hard" (5) proportions.
- **Simplicity Cluster**: Tasks like "notification trigger" and "public transit fares" show majority "Very Easy" to "Easy" distributions.
### Interpretation
The data suggests transportation tasks generally fall into moderate difficulty ("Medium" or "Easy"), with system-level functions ("system control," "long trip itinerary") being notably complex. The "ALL" category's distribution indicates an average difficulty skew toward "Medium," implying most transportation functions require moderate technical effort. Outliers like "notification trigger" (simplest) and "system control" (most complex) highlight variability in task design complexity. The absence of "Unexecutable" (-1) in most tasks suggests all functions are technically feasible, though implementation difficulty varies significantly.