## Line Chart: Attention Weights for Llama3 Models
### Overview
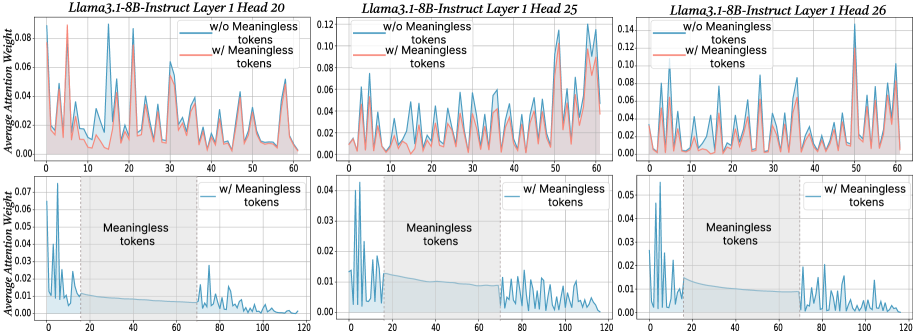
The image presents six line charts comparing the average attention weight for the Llama3 1-8B-Instruct model across different layers (20, 25, and 26) and conditions: with and without "meaningless tokens". Each chart displays attention weight as a function of token position. The top row shows attention weights without meaningless tokens, and the bottom row shows attention weights with meaningless tokens.
### Components/Axes
* **X-axis:** Token Position. Scales vary per chart, ranging from 0-60 and 0-120.
* **Y-axis:** Average Attention Weight. Scales vary per chart, ranging from 0-0.12.
* **Title:** Each chart is titled with "Llama3.1-8B-Instruct Layer [Layer Number] Head [Head Number]".
* **Legend:** Each chart has a legend indicating two lines: "w/o Meaningless tokens" (red) and "w/ Meaningless tokens" (blue).
* **Shaded Area:** A shaded area under each line represents a smoothed trend.
### Detailed Analysis
**Chart 1: Llama3.1-8B-Instruct Layer 1 Head 20** (Top-Left)
* **w/o Meaningless tokens (Red):** The line fluctuates significantly between approximately 0.00 and 0.11. It generally slopes downward from position 0 to 50, then remains relatively stable. Approximate data points: (0, 0.08), (20, 0.06), (40, 0.03), (50, 0.02).
* **w/ Meaningless tokens (Blue):** The line fluctuates between approximately 0.00 and 0.04. It shows a more erratic pattern with frequent peaks and valleys. Approximate data points: (0, 0.02), (20, 0.03), (40, 0.01), (50, 0.005).
**Chart 2: Llama3.1-8B-Instruct Layer 1 Head 25** (Top-Center)
* **w/o Meaningless tokens (Red):** The line fluctuates between approximately 0.00 and 0.12. It shows a general upward trend from position 0 to 30, then declines. Approximate data points: (0, 0.02), (20, 0.08), (40, 0.05), (60, 0.03).
* **w/ Meaningless tokens (Blue):** The line fluctuates between approximately 0.00 and 0.08. It shows a more stable pattern with less pronounced peaks and valleys. Approximate data points: (0, 0.01), (20, 0.04), (40, 0.03), (60, 0.02).
**Chart 3: Llama3.1-8B-Instruct Layer 1 Head 26** (Top-Right)
* **w/o Meaningless tokens (Red):** The line fluctuates between approximately 0.00 and 0.14. It shows a general upward trend from position 0 to 30, then declines. Approximate data points: (0, 0.02), (20, 0.10), (40, 0.06), (60, 0.04).
* **w/ Meaningless tokens (Blue):** The line fluctuates between approximately 0.00 and 0.08. It shows a more stable pattern with less pronounced peaks and valleys. Approximate data points: (0, 0.01), (20, 0.05), (40, 0.04), (60, 0.03).
**Chart 4: Llama3.1-8B-Instruct Layer 1 Head 20** (Bottom-Left)
* **w/ Meaningless tokens (Blue):** The line fluctuates between approximately 0.00 and 0.04. It shows a more erratic pattern with frequent peaks and valleys. The x-axis ranges from 0 to 120. Approximate data points: (20, 0.02), (60, 0.01), (100, 0.005).
**Chart 5: Llama3.1-8B-Instruct Layer 1 Head 25** (Bottom-Center)
* **w/ Meaningless tokens (Blue):** The line fluctuates between approximately 0.00 and 0.03. It shows a more erratic pattern with frequent peaks and valleys. The x-axis ranges from 0 to 120. Approximate data points: (20, 0.015), (60, 0.01), (100, 0.008).
**Chart 6: Llama3.1-8B-Instruct Layer 1 Head 26** (Bottom-Right)
* **w/ Meaningless tokens (Blue):** The line fluctuates between approximately 0.00 and 0.05. It shows a more erratic pattern with frequent peaks and valleys. The x-axis ranges from 0 to 120. Approximate data points: (20, 0.025), (60, 0.015), (100, 0.01).
### Key Observations
* The attention weights are generally higher when meaningless tokens are *not* present (red lines) in the first three charts.
* The bottom row charts (with meaningless tokens) show significantly lower attention weights overall.
* The attention weights tend to decrease as the token position increases, particularly in the top row charts.
* The lines representing "w/o Meaningless tokens" exhibit more pronounced fluctuations than those representing "w/ Meaningless tokens".
### Interpretation
The data suggests that the presence of "meaningless tokens" significantly reduces the average attention weight assigned to each token by the Llama3 model. This indicates that the model focuses less on these tokens, potentially treating them as noise. The varying attention weights across different layers (20, 25, and 26) suggest that the model's attention mechanism evolves as information propagates through the network. The downward trend in attention weights with increasing token position could indicate that the model prioritizes earlier tokens in the sequence. The smoothed areas under the lines suggest a general trend, while the fluctuations represent the model's dynamic attention allocation. The difference in scale between the top and bottom rows highlights the substantial impact of meaningless tokens on attention distribution. The charts provide insights into how the model processes information and the role of meaningful vs. meaningless tokens in its attention mechanism.